A/B Testing — 2 Mar 2019
Mobile A/B Testing: Statistical Significance and Confidence Level
 Liza Knotko
Liza Knotko
Liza Knotko

The aim of mobile A/B testing is to check if a modified version of an app page element is better compared to the control variation in terms of a certain KPI. In the context of app store pages A/B testing, conversion becomes a core KPI most of the times.
However, we all know that it’s not enough to create an experiment with 2 variations, fill it with a dozen of users and expect distinctive and trustworthy results. What turns any split-test into an A/B test you can trust then?
The main characteristic that defines a successful A/B experiment is a high statistical significance which presupposes you’ll actually get a conversion increase the test promised uploading a winning variation to the store.
In this post, we’ll try to deconstruct each step of calculations behind checking the statistical significance of mobile A/B testing results on the following example.

Let’s consider that the Prisma team wanted to run an A/B test and find out if their new set of optimized screenshots favors conversion rate increase. The existing screenshots were used in variation A which became the control one. The updated screens set was used in variation B.
Let’s imagine that each variation was visited by 14 500 different users:
What conclusions can be drawn from this test?
The mobile A/B testing calculator will help us in our results analysis. As it can be seen in the picture below, the confidence level we chose amounts to 95%. This is the parameter value which is usually used in split-tests. You can also come across 90% and 99% confidence levels, other parameter values are quite rare.
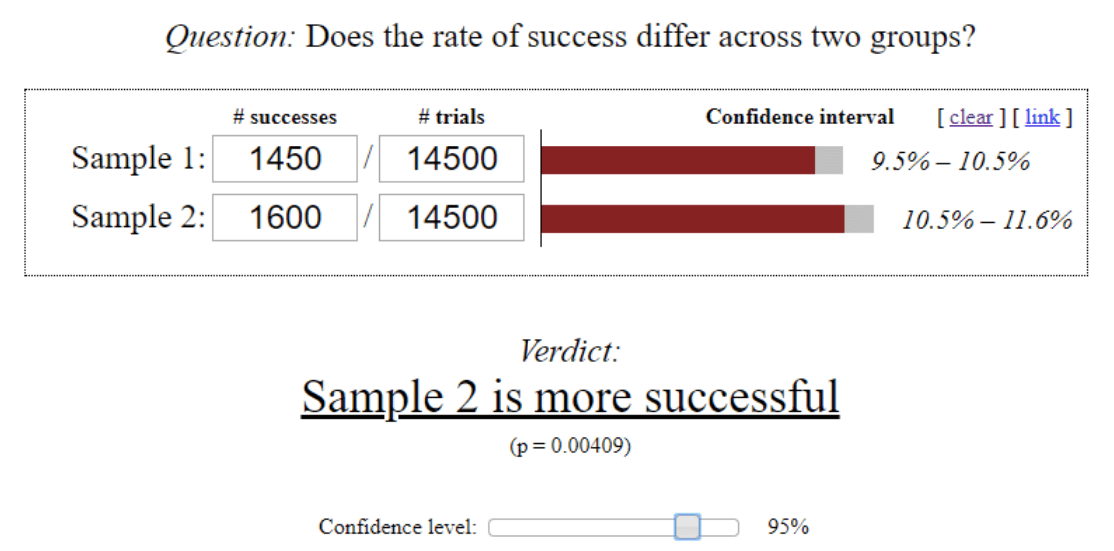
As you can see, the calculator provided the confidence interval of the conversion rate for each variation. This metric measures the probability that app store conversion will fall between two set values.
This estimation leads us to the conclusion that variation B with 10.5% – 11.6% conversion interval performed better than control variation A with 9.5%-10.5% interval.
Point estimate of conversion is the ratio of the converted users number to the total number of users that visited the page. So let’s calculate point estimate value for variations A and B of our example.
Therefore, we see once again that variation B triggers 0.01 better conversion in comparison with the control variation A. It means that the conversion of variation B is 10% better than the conversion rate of variation A (0.01 / 0.1 = 0.1).

Mind that the conversion rates we got are not exact, they represent estimated values which means they are the result of product page mobile A/B testing on two groups of users randomly chosen from the statistical population. Indeed, it’s quite unlikely that someone is capable of running a test on every single app store user that meets your targeting.
However, why we can use estimated values instead of exact ones?
Let’s consider an example to answer this question. Let’s imagine that a company with 20 000 employees decided to test the page of their interior web-service. Suppose all employees participated in the experiment and 1980 of them took the desired action. Therefore, we can calculate the exact conversion rate:
1980 / 20000 = 9.9%
Yet, it’s quite problematic to have a test on all employees in practice. Let alone tracking behaviour of all potential app users.
That’s why we normally run tests on a statistical population sample of randomly chosen users.
This statistical population sample of randomly chosen users is referred to as sample size in statistics.
Going back to our example, if we run a test on 500 randomly chosen employees of the company, it’s impossible to get 9.9% conversion rate as 500 * 9.9% = 49.5 and the number of people can’t be nonintegral.
Thus, we are to presuppose a certain measurement of error to represent sum total using a group.
Let’s imagine that the company ran 2 tests with 500 employees each:
These numbers are different and they don’t coincide with the exact conversion rate (9.9%) either. Nevertheless, if we set ± 0.2% interval, we’ll get the interval estimate of 9.6% – 10% and our exact estimate will be within this range.
Let’s examine the formula behind confidence intervals for Prisma’s experiment the calculator we used provided:
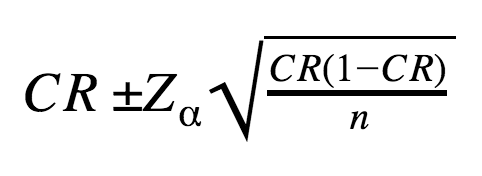
CR – point estimate of conversion rate;
n – sample size (14500 uses that visited a corresponding product page variation),
Zα – coefficient corresponding to Confidence Level α (in statistical terms, it’s Z-score of standard deviation).
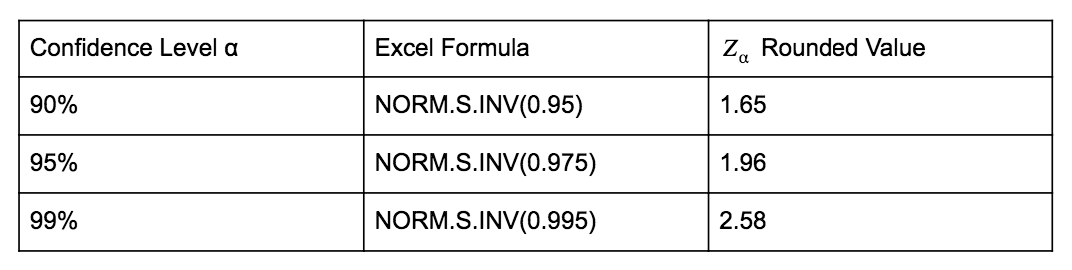
Zα can be calculated with Excel NORM.S.INV function. Here is the table containing rounded Zαvalues for the most widely used confidence levels:
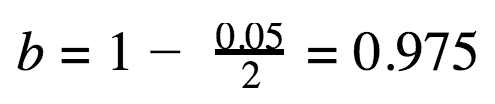
The NORM.S.INV argument is calculated with the following formula in which α stands for a confidence level:
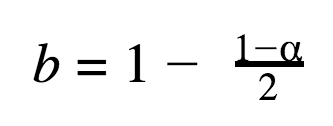
Let’s do the calculations for the 95% confidence level:
Now we can calculate the confidence interval for Prisma’s variation A (α = 95%, therefore, Zα = 1.96).
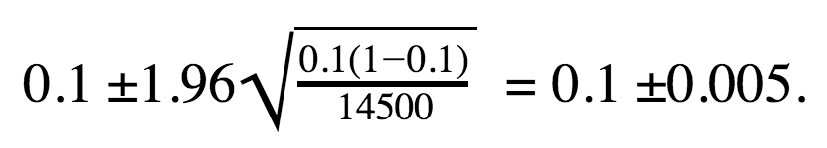
Thus, the confidence interval for Prisma’s control variation A can be represented as 10% ± 0.5% or 9.5% – 10.5%.
Now, we’ll try to interpret the result. Let’s assume that we know the exact conversion rate of variation A which means we can estimate the CR calculated for all potential visitors of variation A page.
If we decide to test the conversion of this product page running the same experiment on different user groups from the same statistical population, we can calculate confidence intervals for each of these groups using 95% confidence level.
It means that the exact conversion rate will be within confidence interval margins in 95% of cases.
We’ve already come to the conclusion that variation B is better than the control one as CR(B) is greater than CR(A). However, before uploading screenshots set from variation B to the store, it’s necessary to ensure that the difference of variations performance is statistically significant. Below you will find the A/B testing significance formula.
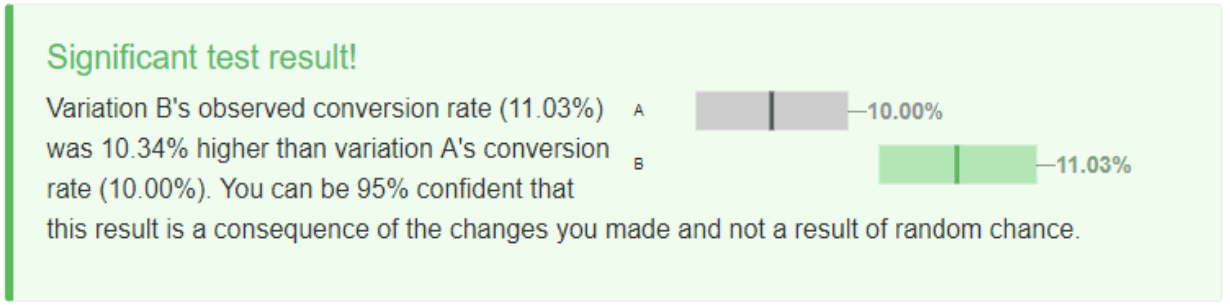
Statistical significance in testing is always bound to the confidence level we choose (95% in our case). If we enter the data from Prisma experiment to the mobile A/B Testing Calculator, we’ll come across the following conclusion:
You can be 95% confident that this result is a consequence of the changes you made and not a result of random chance.
Some analytical tools formulate the same conclusion in the following way: «Chance to beat original is 95%» (in our example, A is an original).
Mathematical tools for statistical hypothesis testing are commonly used to confirm the statistical significance of the difference in variations performance. The following 3-step algorithm facilitates hypothesis testing process:
If the p-value is lower than 1-α, the alternative hypothesis is accepted with confidence level α. Otherwise, the null hypothesis is accepted.
Now, let’s check the statistical significance of the conclusion that conversion rate of variation B is greater than the one of the control variation A using the algorithm mentioned above.
Our null hypothesis can be formulated as CR(B) – CR(A) = 0 which means the conversions of variations have no difference. Therefore, our alternative hypothesis will state that the conversion of variation B is greater than the one of the variation A: CR(B) > CR(A).