Benchmarks Report 2020: Apple Search Ads Cost & Performance Metrics
 Anastasia Sidoryk
  Anastasia Sidoryk
 The App Store is competitive as never before. According to Apptopia, there are over 1.8 million publishers and 4.1 million iOS apps out there, of which games account for 20%, while non-gaming apps represent 80% of the total.
Apple Search Ads has been growing strong as a way to withstand such severe competition. AppsFlyer suggests that in 2019 the channel increased “its share in the global app install pie by 82%”.
Indeed, hitting the blue-colored ads spot above the organic search results offers a visibility advantage. However, the majority of iOS publishers ignore this opportunity: fewer than 20% of them run ads on the App Store (AppsFlyer). The ads channel keeps having considerable untapped potential.
But for now, let’s focus on those who use Apple Search Ads to reach out to their users. We’ve made research to understand the average App Store metrics to deliver the recent paid Search Ads benchmarks in the form of a report.
The report includes:
The report is based on the aggregated data from apps linked to SearchAdsHQ, dated from March 2019 to February 2020:
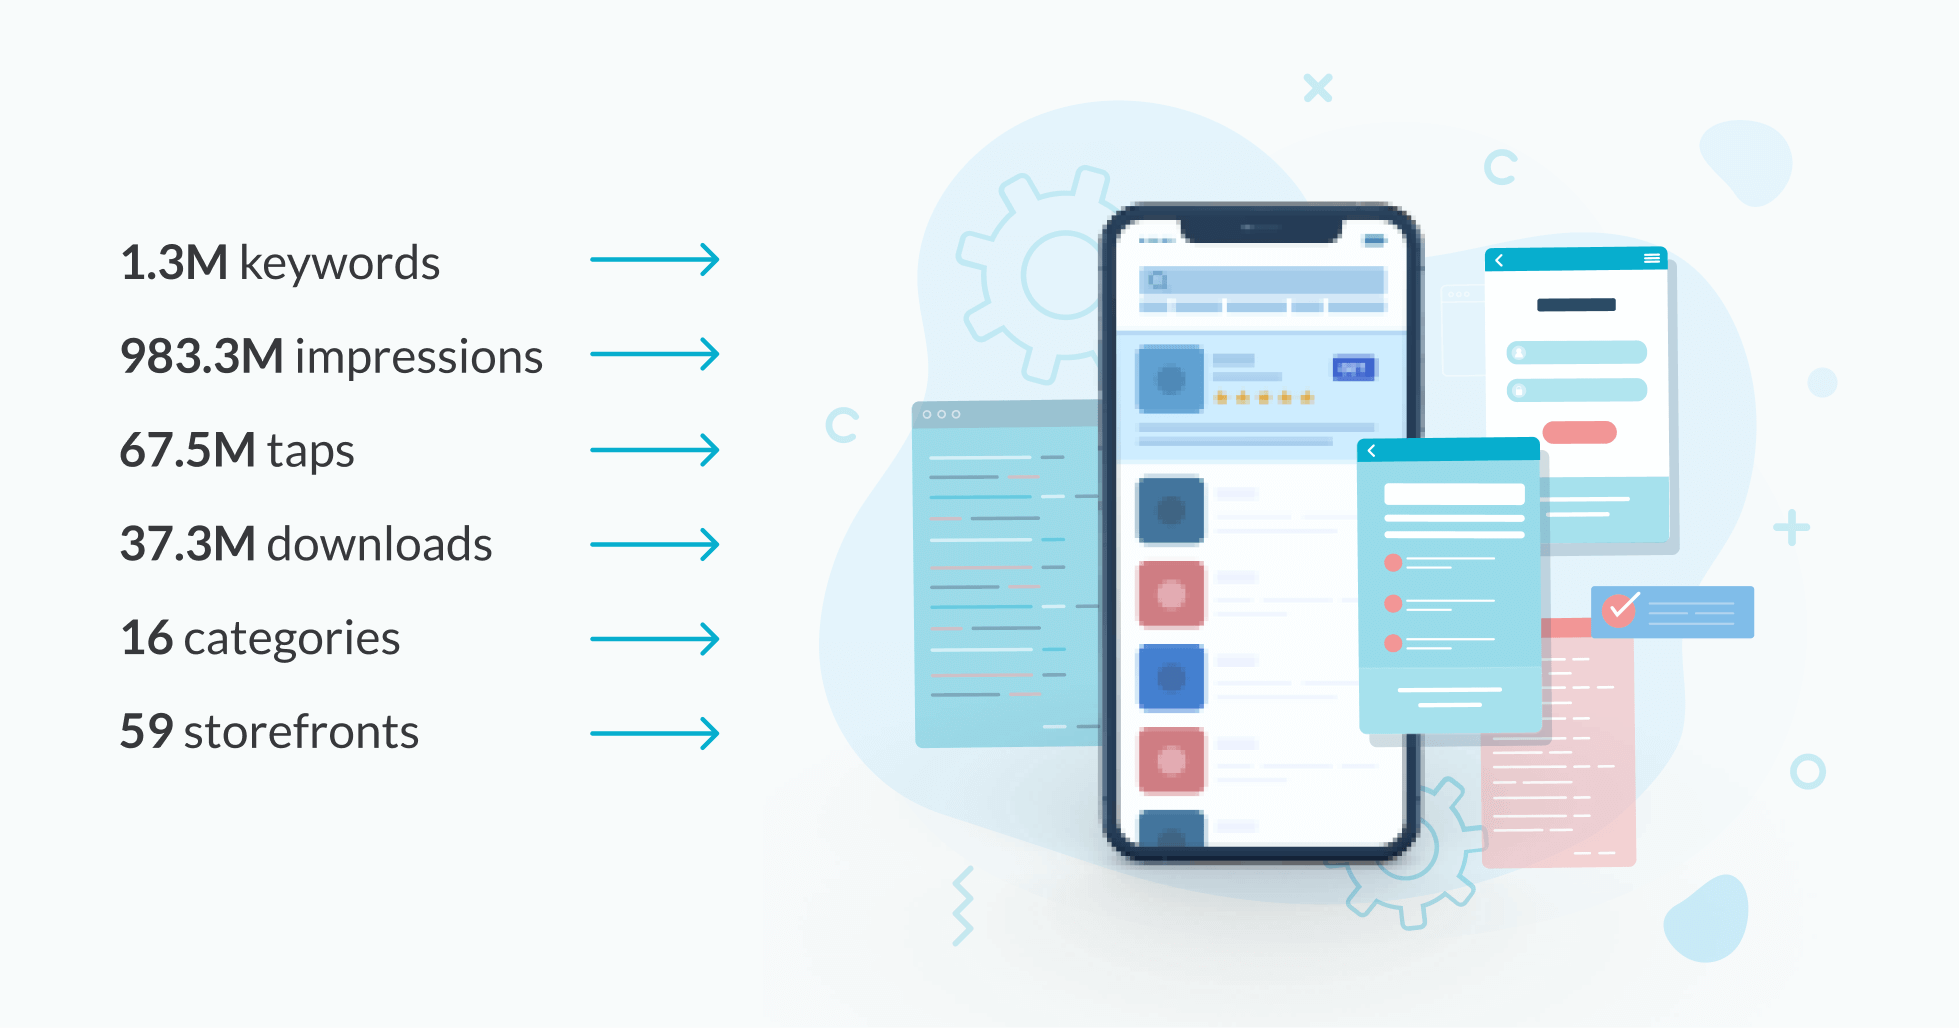
As you can see, the Apple Search Ads Benchmarks report is based on keywords and App Store metrics from impressions to downloads.
To deliver consistent and reliable stats, we’ve left out categories with insufficient data on spend and apps, as well as app publishers with distinctive UA strategies that could produce unreliable results in aggregate.
To calculate the averages, we used the sum of the data values included in a specific category or storefront.
Leverage SplitMetrics’ Apple Search Ads Benchmark Dashboard to assess the most recent averages – all key metrics at one place, and don’t bother looking for them anywhere else. You have everything to assess your ad performance and improve it if necessary.
We’ve discovered that the average TTR on Apple Search Ads is currently around 6.84%. Compared to the average of the previous year, 6.06%, it has slightly increased.
What are the possible reasons for the uplift?
Firstly, creative sets.
Apple Search Ads introduced them almost two years ago for Advanced campaigns. Creative sets enable to align groups of screenshots and app previews to keyword themes or audiences, which favors better ad performance. Wider adoption of creative sets may be one of the reasons for a higher Tap-through Rate.
Secondly, Apple Search Ads is testing a new way to increase impression volume – the ads rotation. To be more precise, if a user scrolls down the ad without tapping on it and then scrolls back up, the ads banner will be replaced with the one offered by the closest bidder.
Another reason for a bigger average TTR may be that apps who have a longer history of running Apple Search Ads have well-optimized accounts. Moreover, users get used to App Store ads and don’t have trouble clicking on them.
What is a good TTR for apple search ads categories? Below are the two charts showing the average TTRs in 2019 and Q1 2020:
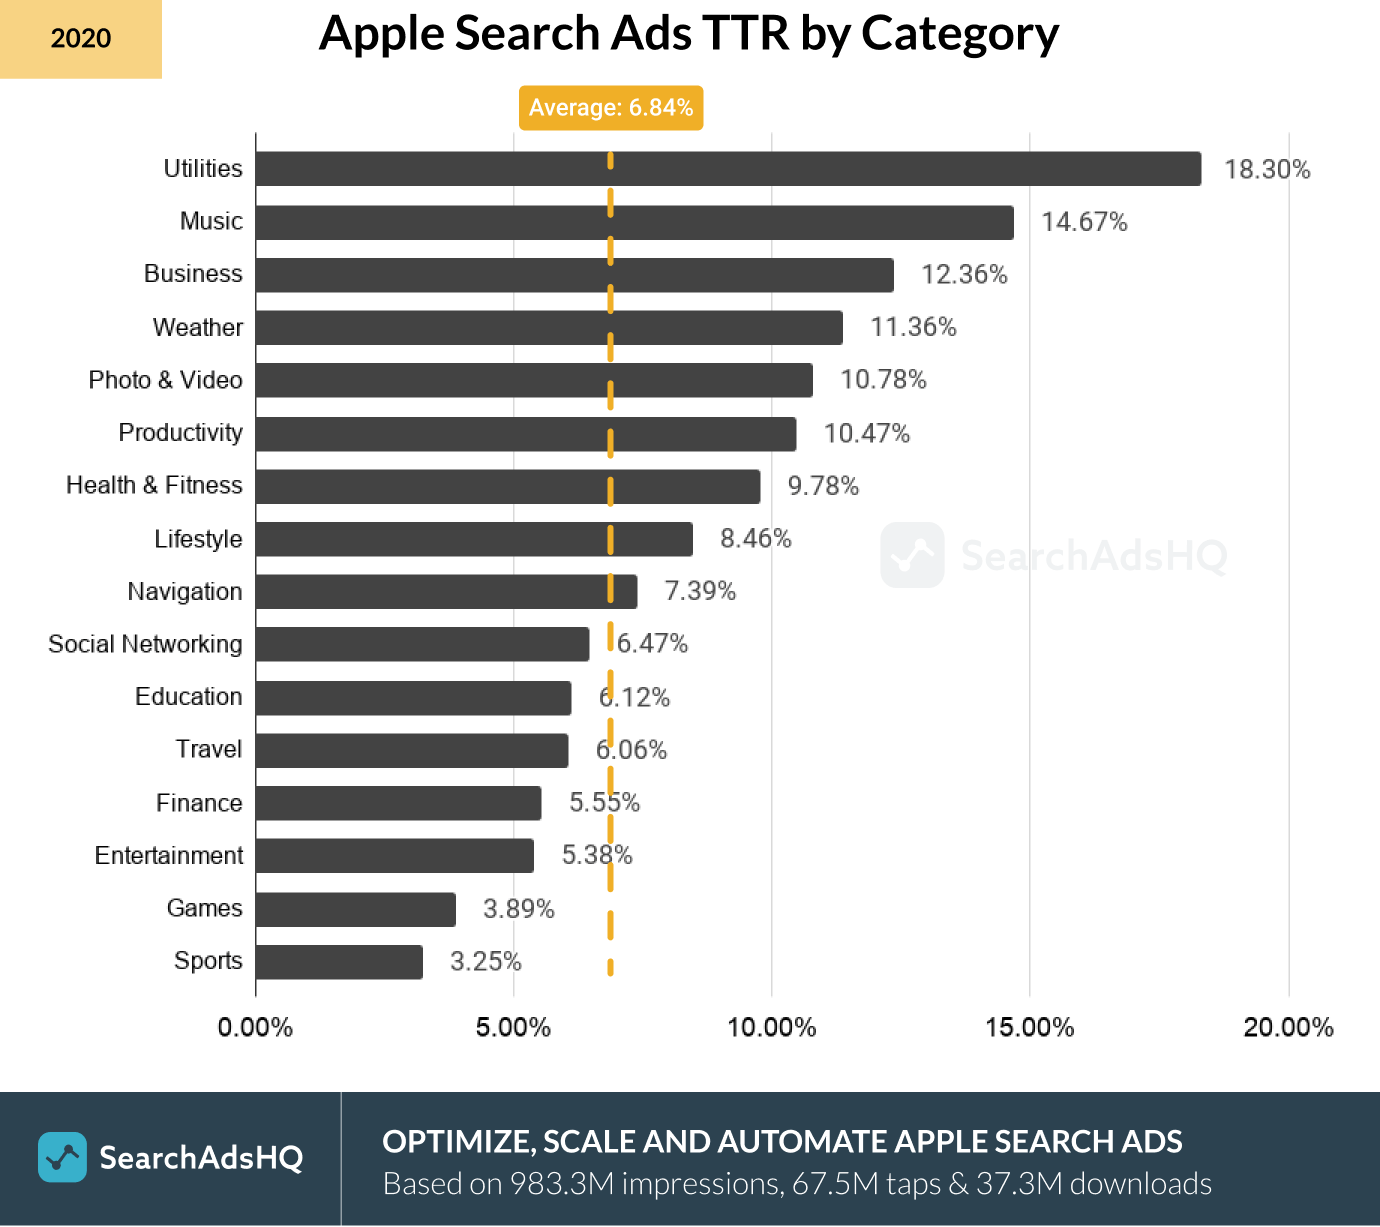
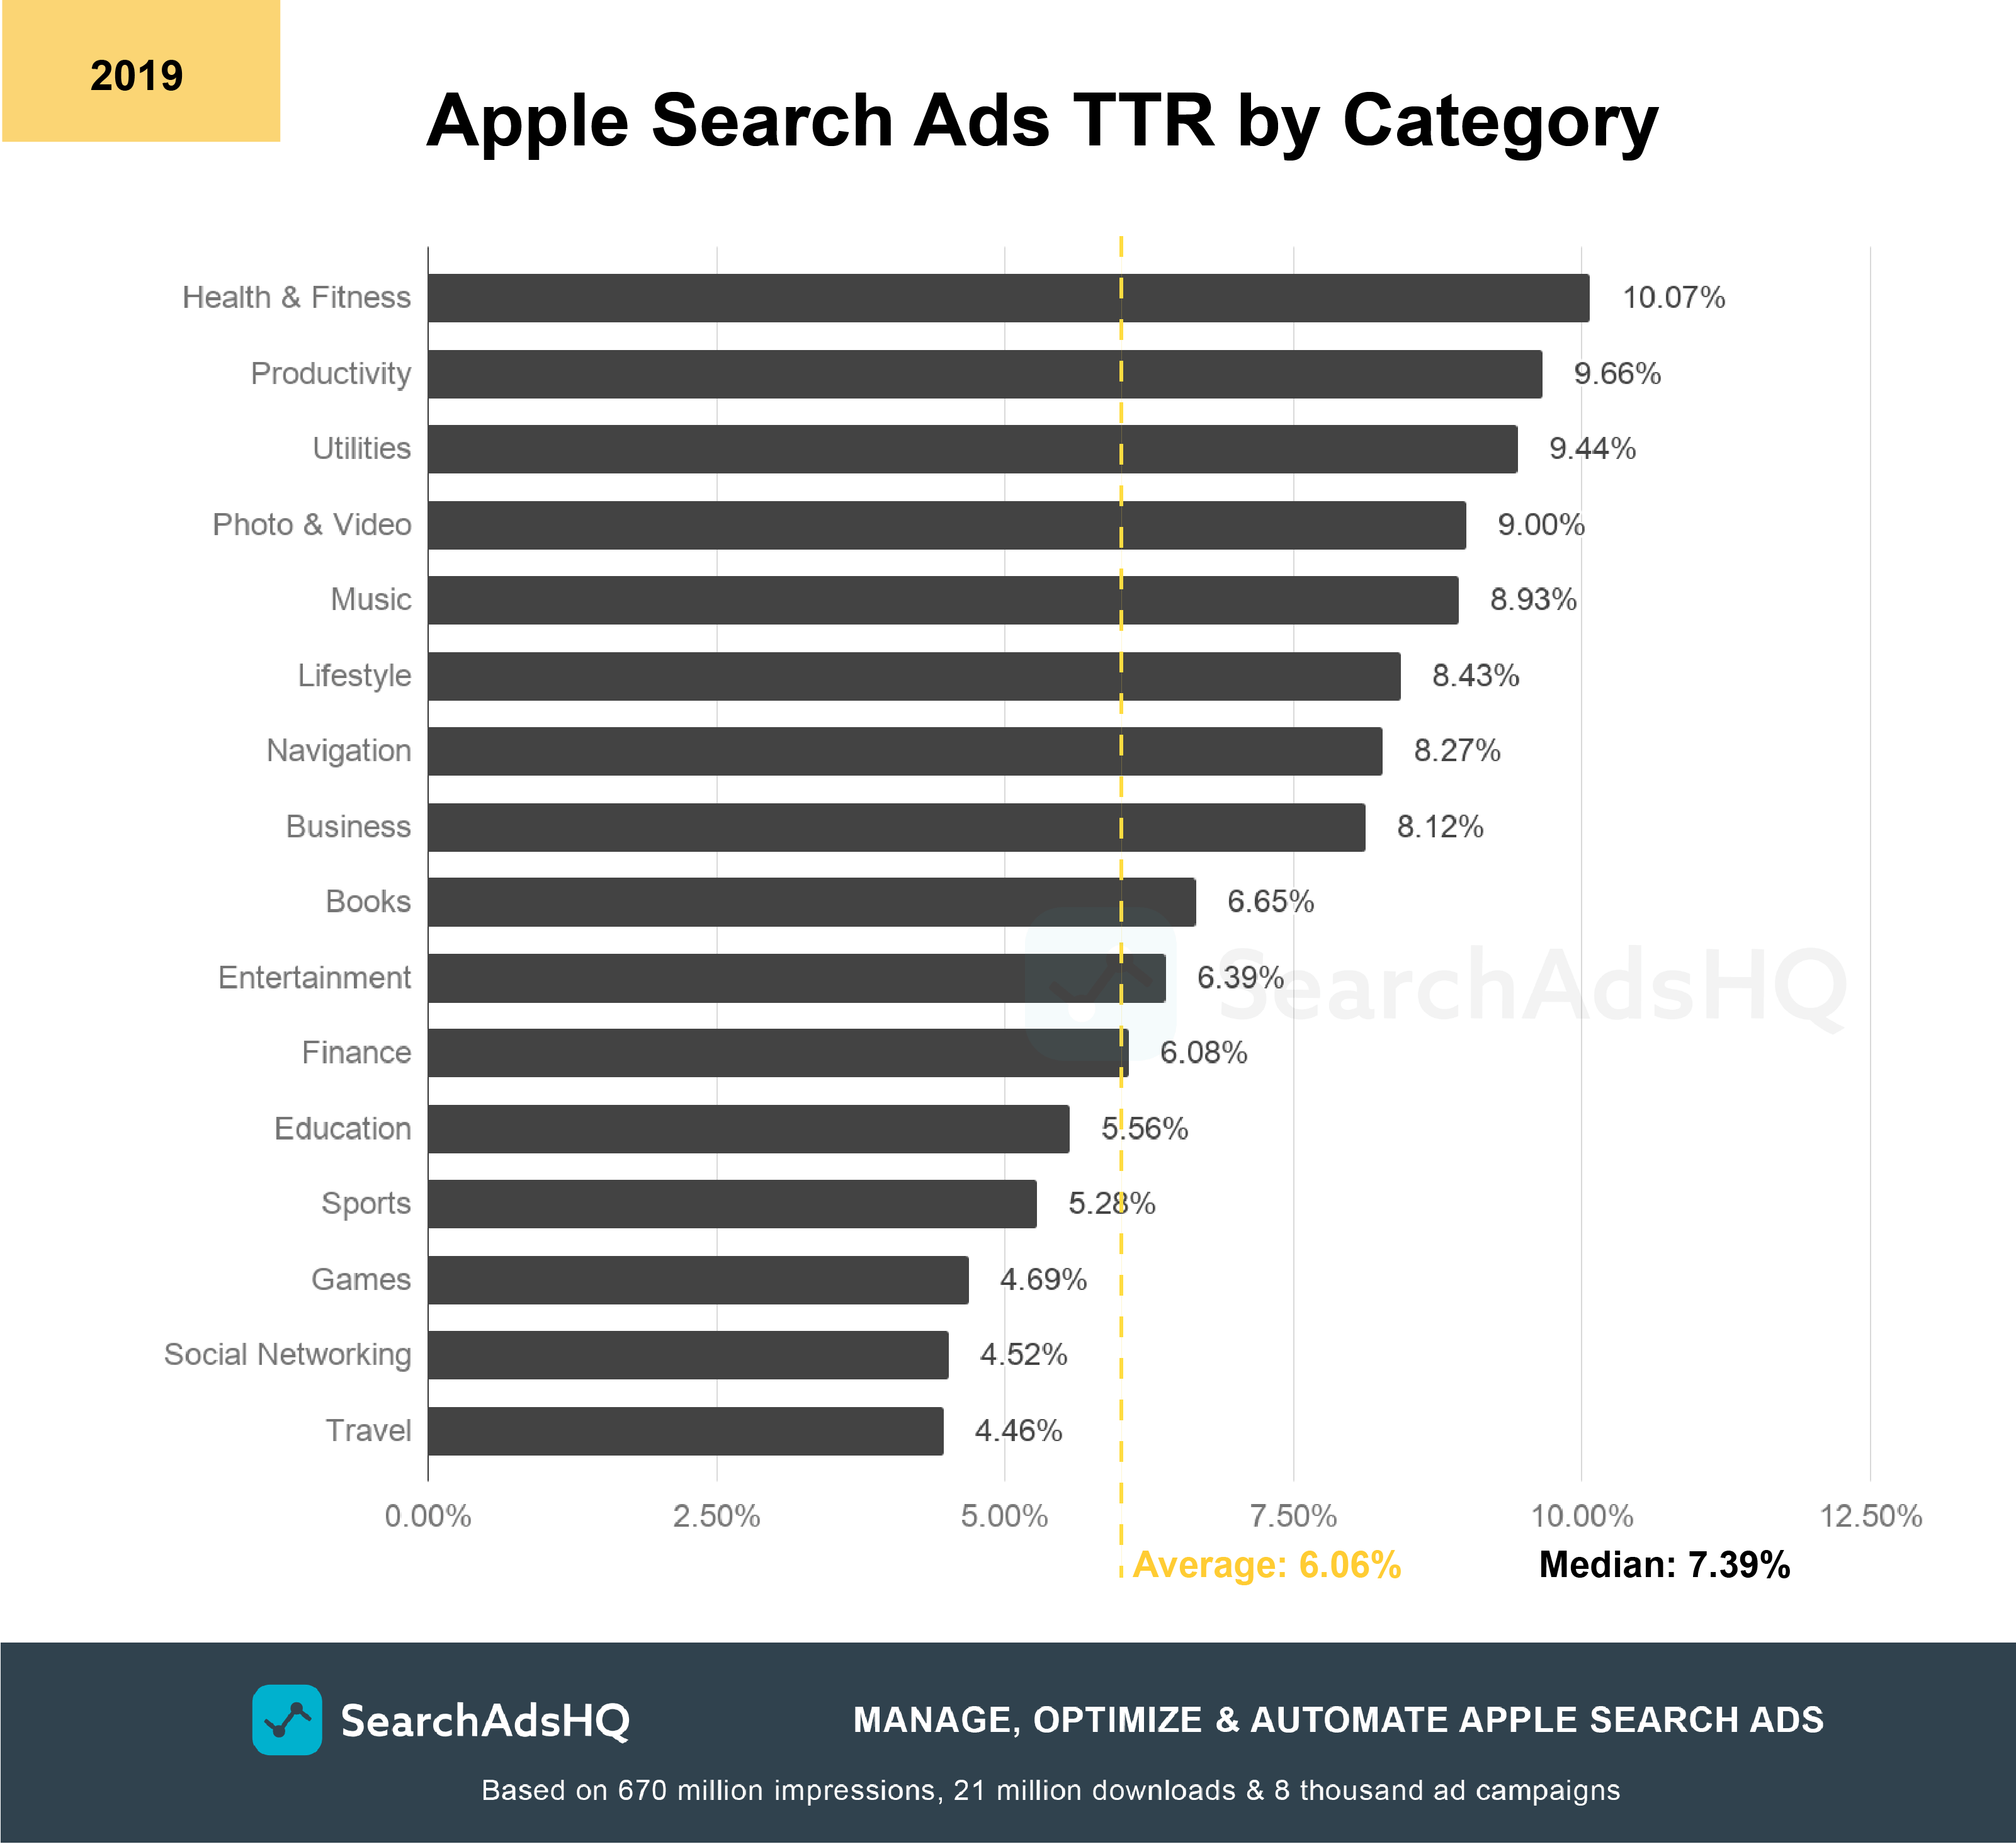
Obviously, in 2019 top categories by Tap-through Rate are Utilities, Music and Business. Their average TTRs are considerably bigger than 6.84%, the total average across all the 16 categories.
More than that, TTR in Utilities has doubled compared to the previous year – from 9.44% up to 18.30%.
Conversely, the lowest TTR values are observed in Entertainment, Games and Sports.
One of the possible reasons for a low TTR in Sports (3.25%) is its high seasonality nature. It may have periods of ups and downs in terms of popularity caused by external sports events, which may bring down the aggregate performance metrics of the category.
As for Gaming, the low TTR value can be explained by the category’s huge popularity. As per Statista, this is the most popular App Store category by the share of available apps: 22.37% of all active apps are gaming apps.
Also, in addition to a big number of apps belonging to the Gaming category, users tend to look for them by entering generic search terms. App Store searchers are matched to irrelevant ads and ignore them, hence low TTR: it has dropped from 4.69% to 3.89% compared to the previous year.
Apple declares that the average Search Ads Conversions Rate (CR) is approximately 50%. Our study supports this claim: our sample has shown a very close CR – 47.60%.
Such a big average CR value has a reasonable explanation: Apple Search Ads sponsored banners have premium placement. They are located above the organic results on the App Store, a place where users come with an intention to discover apps through search. As per Apple Search Ads, such users make around 70%, and they are already motivated to install.
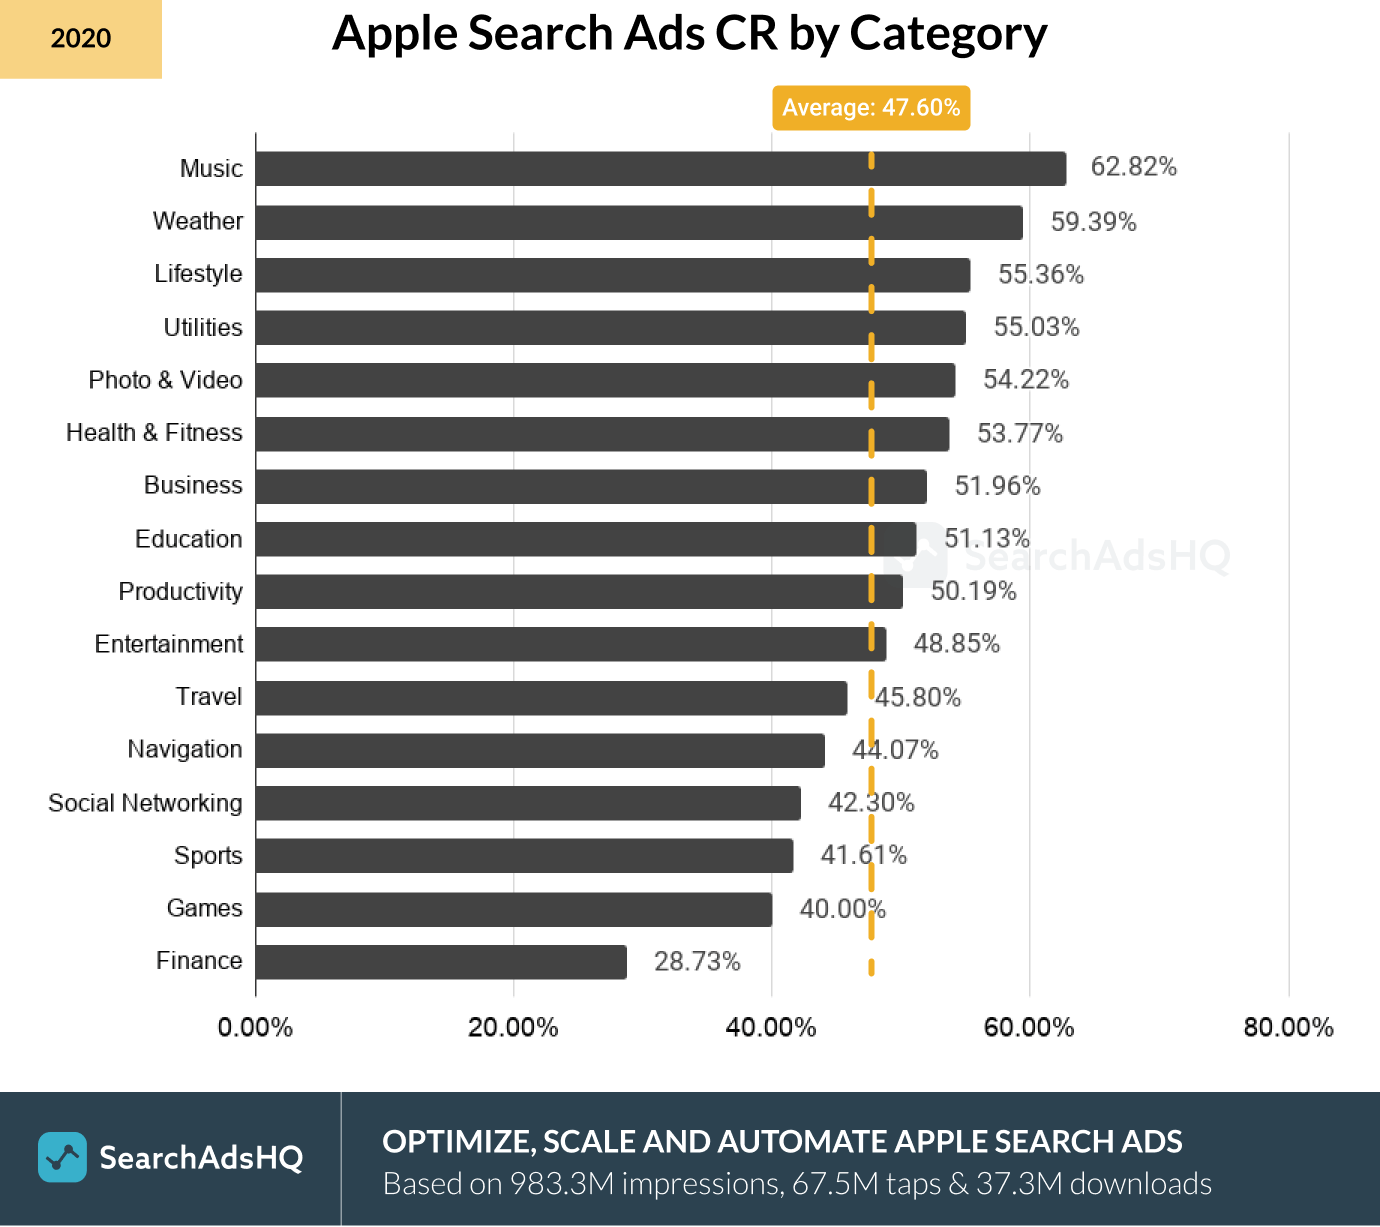
Now that we know the overall average CR, let’s see how it differs across App Store categories:
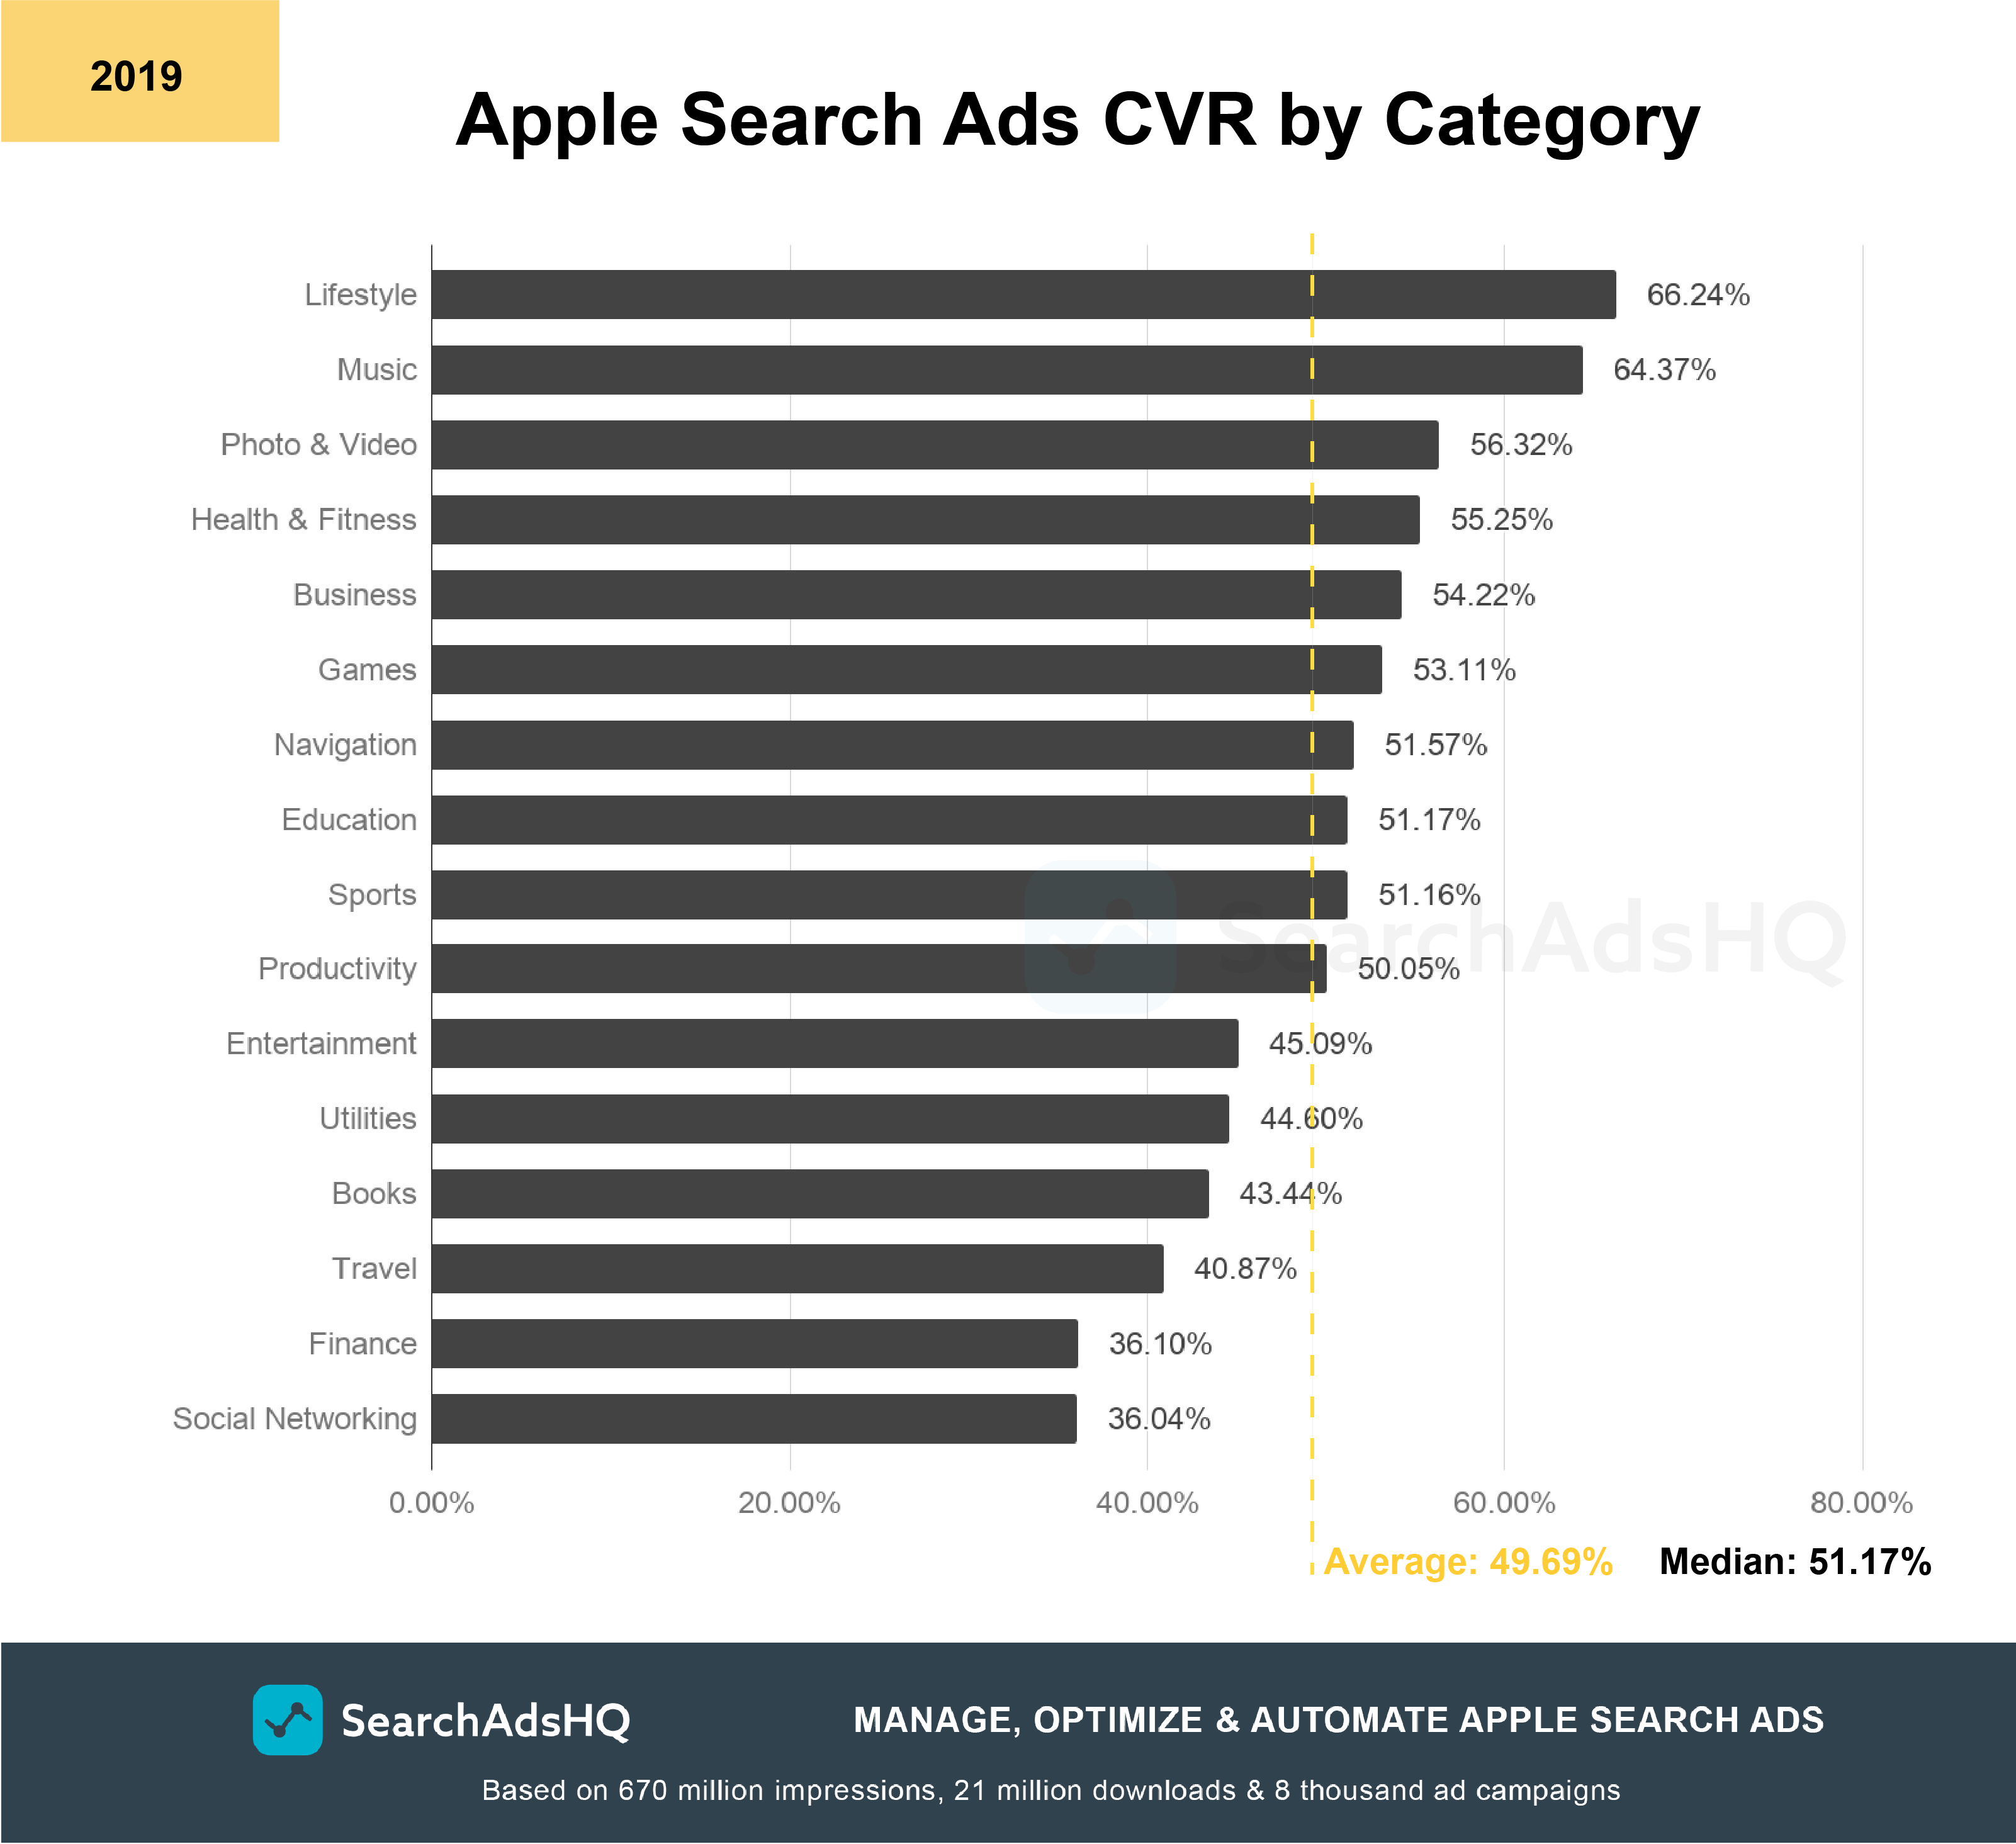
And here’s the chart of the category-specific Apple Search Ads Conversion Rate in 2019:
In 2020, 10 out of the 16 categories under study demonstrate the Conversion Rate above the average (47.60%). Music is a category with the highest average CR – 62.82%.
It is followed by Weather, Lifestyle and Utilities, the top category in terms of TTR, which has also shown a considerable increase in its Conversion Rate compared to the previous year – 55.03% (2020) against 44.60% (2019).
The opposite is true for Lifestyle. Its average CR has dropped from 66.24% in 2019 down to 55.36% in 2020. However, this is still a good Conversion Rate given the fact that the category has quite a low average TTR this year.
A high conversion from taps to downloads doesn’t naturally result from a high TTR. Indeed, you may give App Store users a good reason to tap on your sponsored banner, but your product page can be poorly optimized so people won’t tap “Get”.
A/B testing is a good way to understand which creatives will work best for your audience. By combining it with Apple Search Ads, you can make sure that users you attract through paid ads are more likely to download.
On the opposite side, the lowest Conversion Rates are in Finance (28.73%) and Games, whereas Gaming’s CR has considerably decreased compared to last year – 53.11% (2019) against 40.00% (2020).
In this article, we covered the performance metrics by App Store categories only. If you feel like learning storefront-specific averages, as well as cost metrics – Apple Search Ads CPT and CPA – and their trends throughout the year under research, you can get our free report.
For insights into the recent changes amid the coronavirus outbreak, read our article on The Impact of COVID-19 on Apple Search Ads.
