Correlation: Share of Voice & Apple Search Ads Search Popularity
 Gabriel Kuriata
Gabriel Kuriata
Gabriel Kuriata 
Keyword selection is a process that can make or break your app’s growth prospects. Relevant keywords improve visibility, attract the right audience, and drive higher-quality traffic, increasing the likelihood of app downloads and overall campaign success.
It should be your primary goal to choose relevant keywords and extract their full value. To do this, you need to maximize impressions for the most relevant & profitable search queries, taking the spotlight away from your competitors and taking as much of it as possible for yourself in the process.
How many impressions a keyword can give you? Which metrics can be useful in predicting that and how to optimize your Apple Search Ads campaigns to achieve maximum results?
We answer those questions in this article, by showcasing how to maximize impressions and the share of voice metric available in SplitMetrics Acquire by taking advantage of the Apple Search Ads’ Search popularity index.
To back our claims with hard-data, we conducted an in-depth research of the relationship between Apple Search Ads Search popularity and the number of impressions generated for keywords with a maximized share of voice.
To accomplish this, we’ve teamed up with Merlin Penny, Data Science and Engineering Lead at Phiture. Together, we dived deep into the data available in SplitMetrics Acquire and processed them to present you with our findings in a way that we hope – will improve your user acquisition strategy and lead to more taps and conversions.
Before we dive into the nitty-gritty part of our research, let’s take a brief look at our framework and terminology. There are two metrics we should introduce at this point:
Impression Share
“The share of impressions your ad(s) received from the total impressions served on the same search terms or keywords, in the same countries and regions. Impression share is displayed as a percentage range, such as 0-10%, 11-20%, and so on. This metric is only available in predefined Impression Share custom reports and on the Recommendations page.” Source: Apple Search Ads.
Share of Voice (SoV)
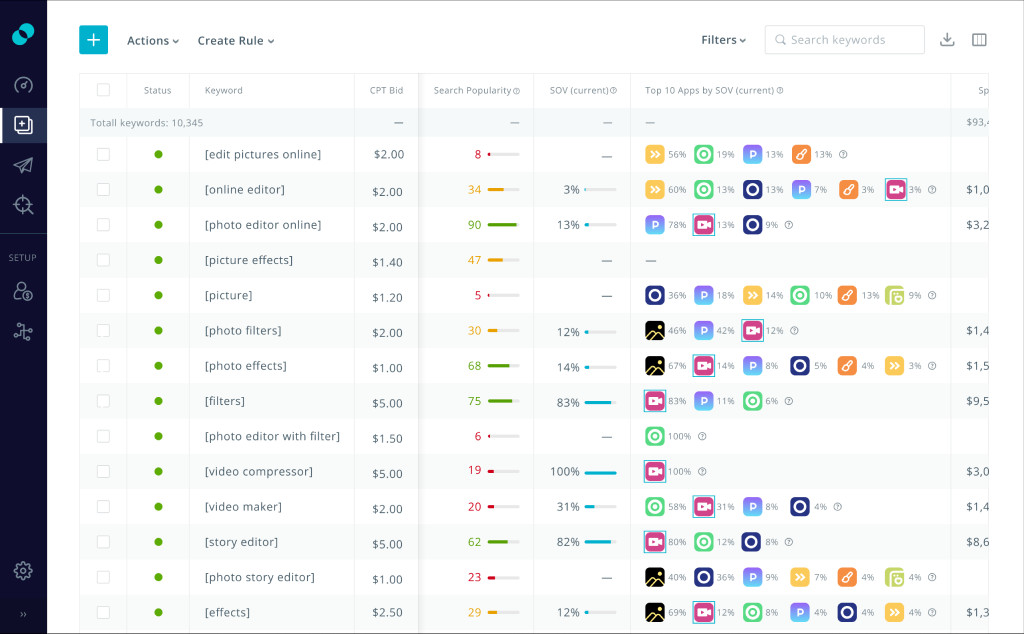
Share of voice is the percentage of ad impressions a particular app receives for a specific keyword compared to all ads shown for that keyword. It indicates your app’s visibility and competitiveness in search results. In SplitMetrics Acquire, share of voice is displayed as integer percentages.
Apple Search Ads includes Impression Share and SplitMetrics Acquire has both metrics. At a first glance, they are very similar. However, there are notable differences between them, for example: how they are displayed (range vs integers) or their data collection period (4 days for impression share vs 1 day for share of voice).
Regardless of those differences, they are complimentary metrics, increasing your oversight over your campaigns. Additionally, in SplitMetrics Acquire, share of voice can be used in automation rules. It can also be easily monitored through dashboard charts and periodic reports. We also highly recommend reading more about our insights and share of voice metric in the article: “Scale Apple Search Ads with Insights”. It showcases more important uses of the share of voice metric on our platform.
One of the ways to assess the App Store search volume is to check Apple Search Ads Search popularity scores that represent keywords popularity.
Search Popularity
“The popularity of a keyword is based on App Store searches. Search popularity is displayed as numbers from 1 to 5, with 5 being the most popular.”
Source: Apple Search Ads.
In the Apple Search Ads interface, the score is represented visually by a system of blue dots, with their number directly related to their numerical value.
It’s a crucial metric to pay attention to, while choosing exact match keywords for our primary Apple Search Ads campaigns from those discovered by Search match Discovery ones.
The data behind the Search popularity indicator in Apple Search Ads allows external services tied to the platform to present a more granular version of it. While using SplitMetrics Acquire and our Keyword Discovery tools, you’ll notice immediately that we’re using a 0-100 range to rate keyword popularity.
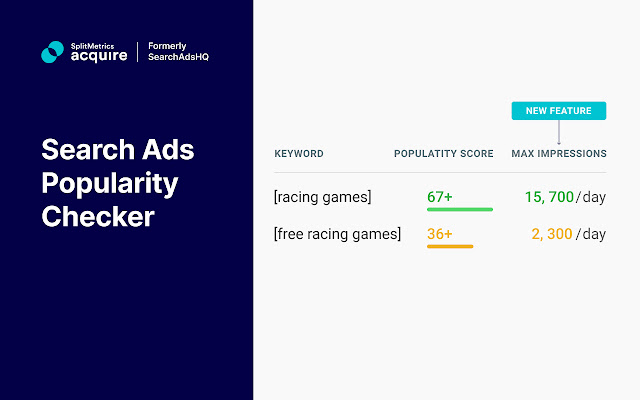
Additionally, you can try the our Search Ads Keyword Popularity Checker released by SplitMetrics for free as a Google Chrome extension. It will allow you to use our index with the native Apple Search Ads user interface:
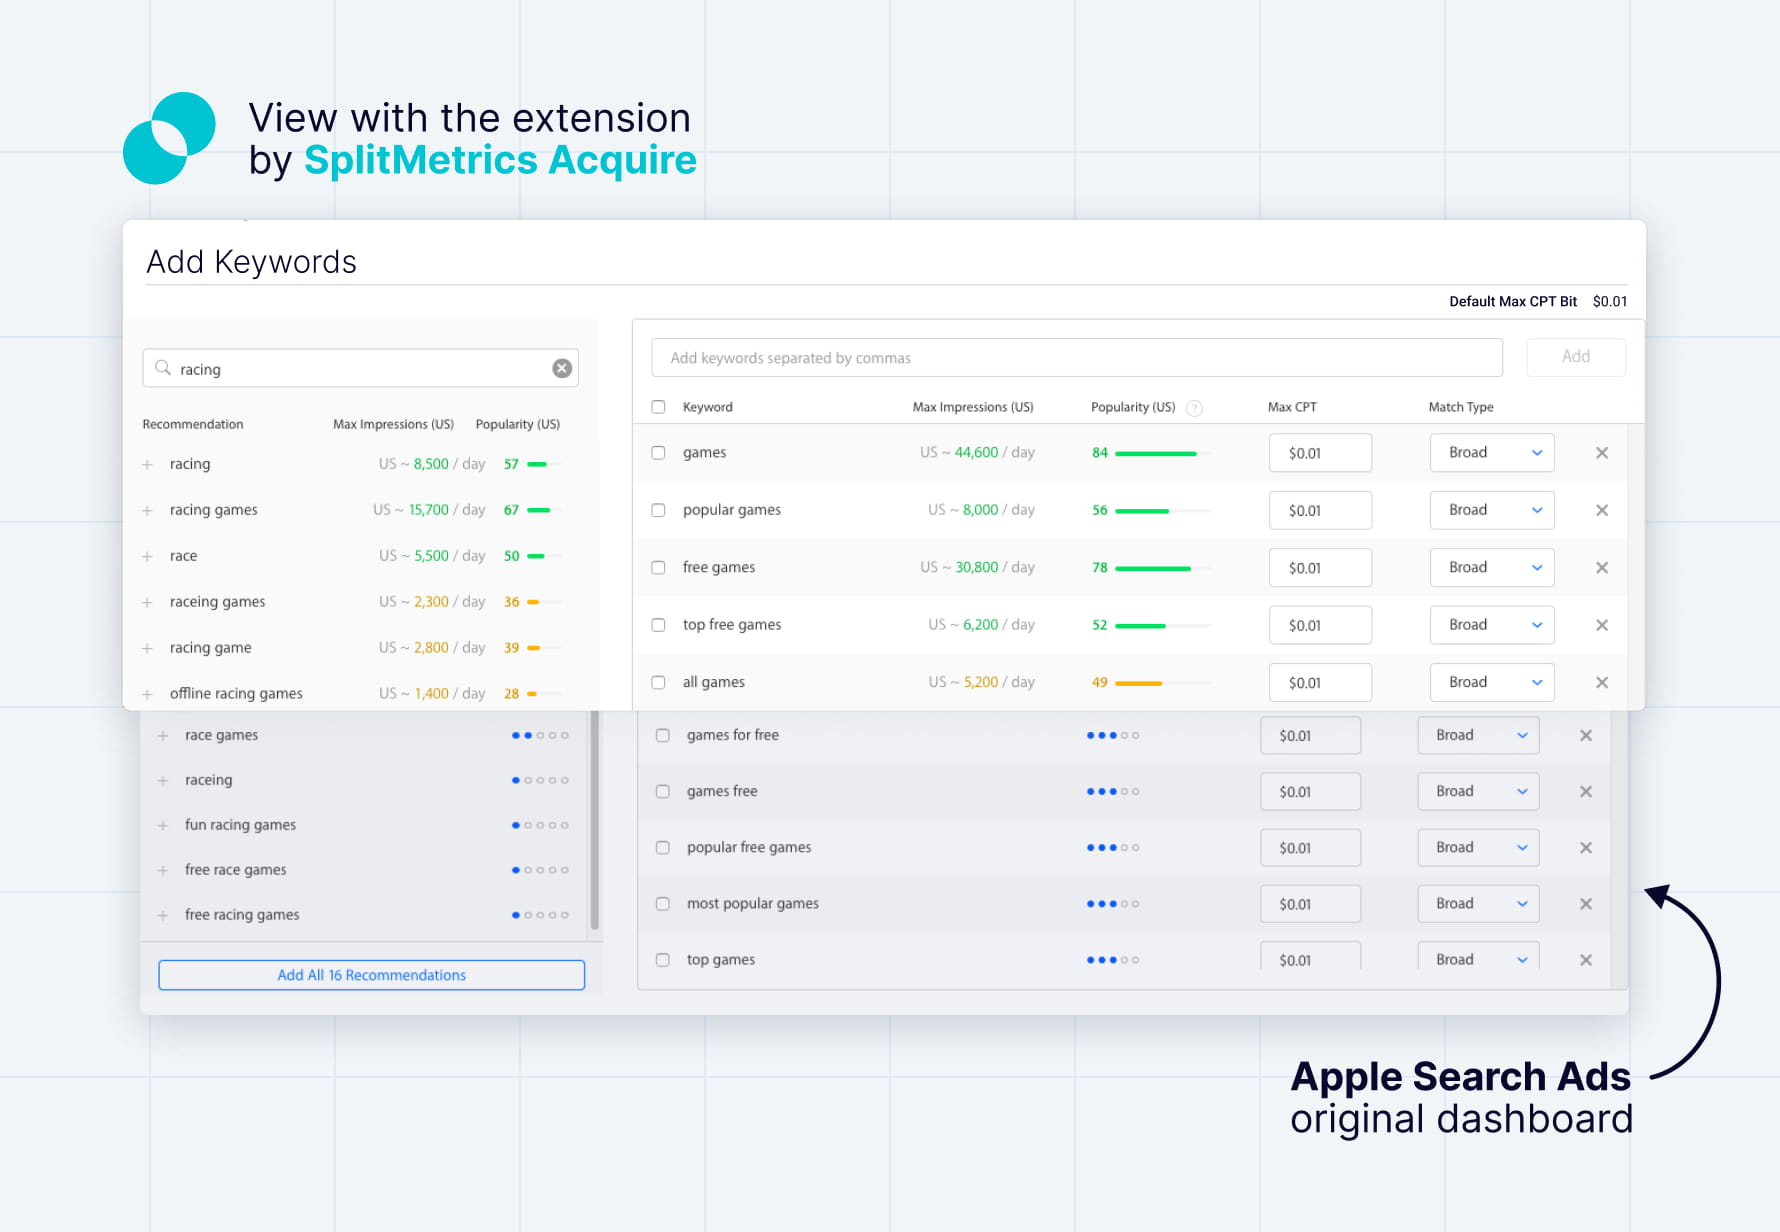
Add it to Google Chrome now:

You can also read more about the checker in this article: NEW: Apple Search Ads Keyword Popularity Checker.
We’ve established our framework and terminology, so now we’re ready to present a short summary of our findings for the US market on the App Store, regarding the relationship between Apple Search Ads Search popularity indicator (as it is presented in SplitMetrics Acquire) and the number of impressions generated for keywords with a maximized share of voice.
Max Impressions = 254.4443 * exp(0.0615 * Search Popularity)
For example, for a Search popularity of 60 the maximum impressions are at least 10,000, while for a Search popularity of 82 there are at least 40,000 impressions. In the table below, you can find some Search popularity scores with the relevant estimated volume:
| Search popularity | Estimated impressions per day |
| 10 | 500 |
| 20 | 900 |
| 30 | 1600 |
| 40 | 3000 |
| 50 | 5500 |
| 60 | 10000 |
| 70 | 19000 |
| 80 | 35000 |
In other words, the current status of impressions will be reflected in Search popularity only in a while.
The research is based on 30,805 search terms collected in the US App Store for the period from August to October 2019. We’ve gathered daily data with the search terms and Apple Search Ads impressions, and for each day and search term Search popularity was added. All the above resulted in 315,993 observations that you can see below:
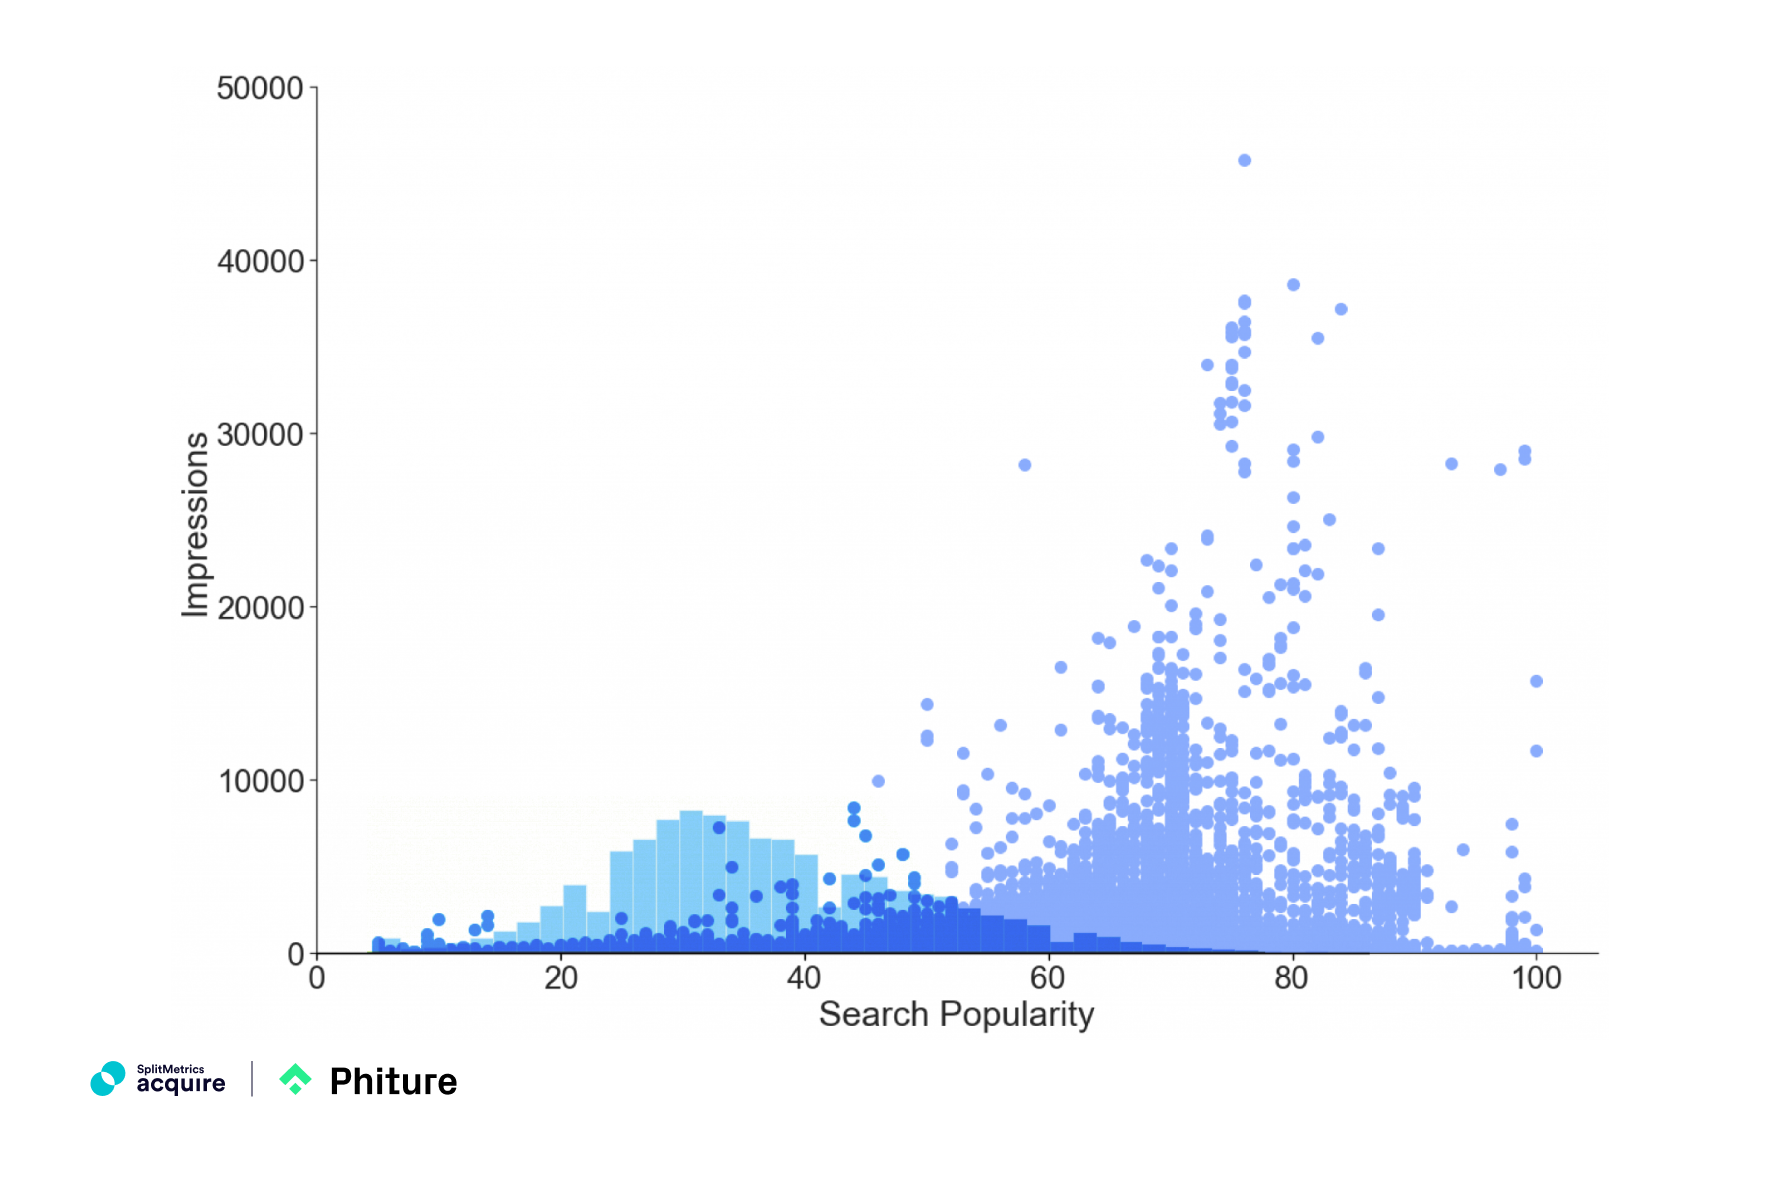
This graph depicts the raw uncleaned data where:
The graph doesn’t show the outliers with daily App Store impressions of up to 0.5 million. These are search terms with extremely high Apple Search Ads Search popularity scores – 98 or 99, such as “instagram” or “snapchat”.
To get insights into how Apple’s Search popularity index works, a qualitative analysis was performed. For three randomly picked search terms, daily data for impressions and Search popularity were collected to get the graphs below:
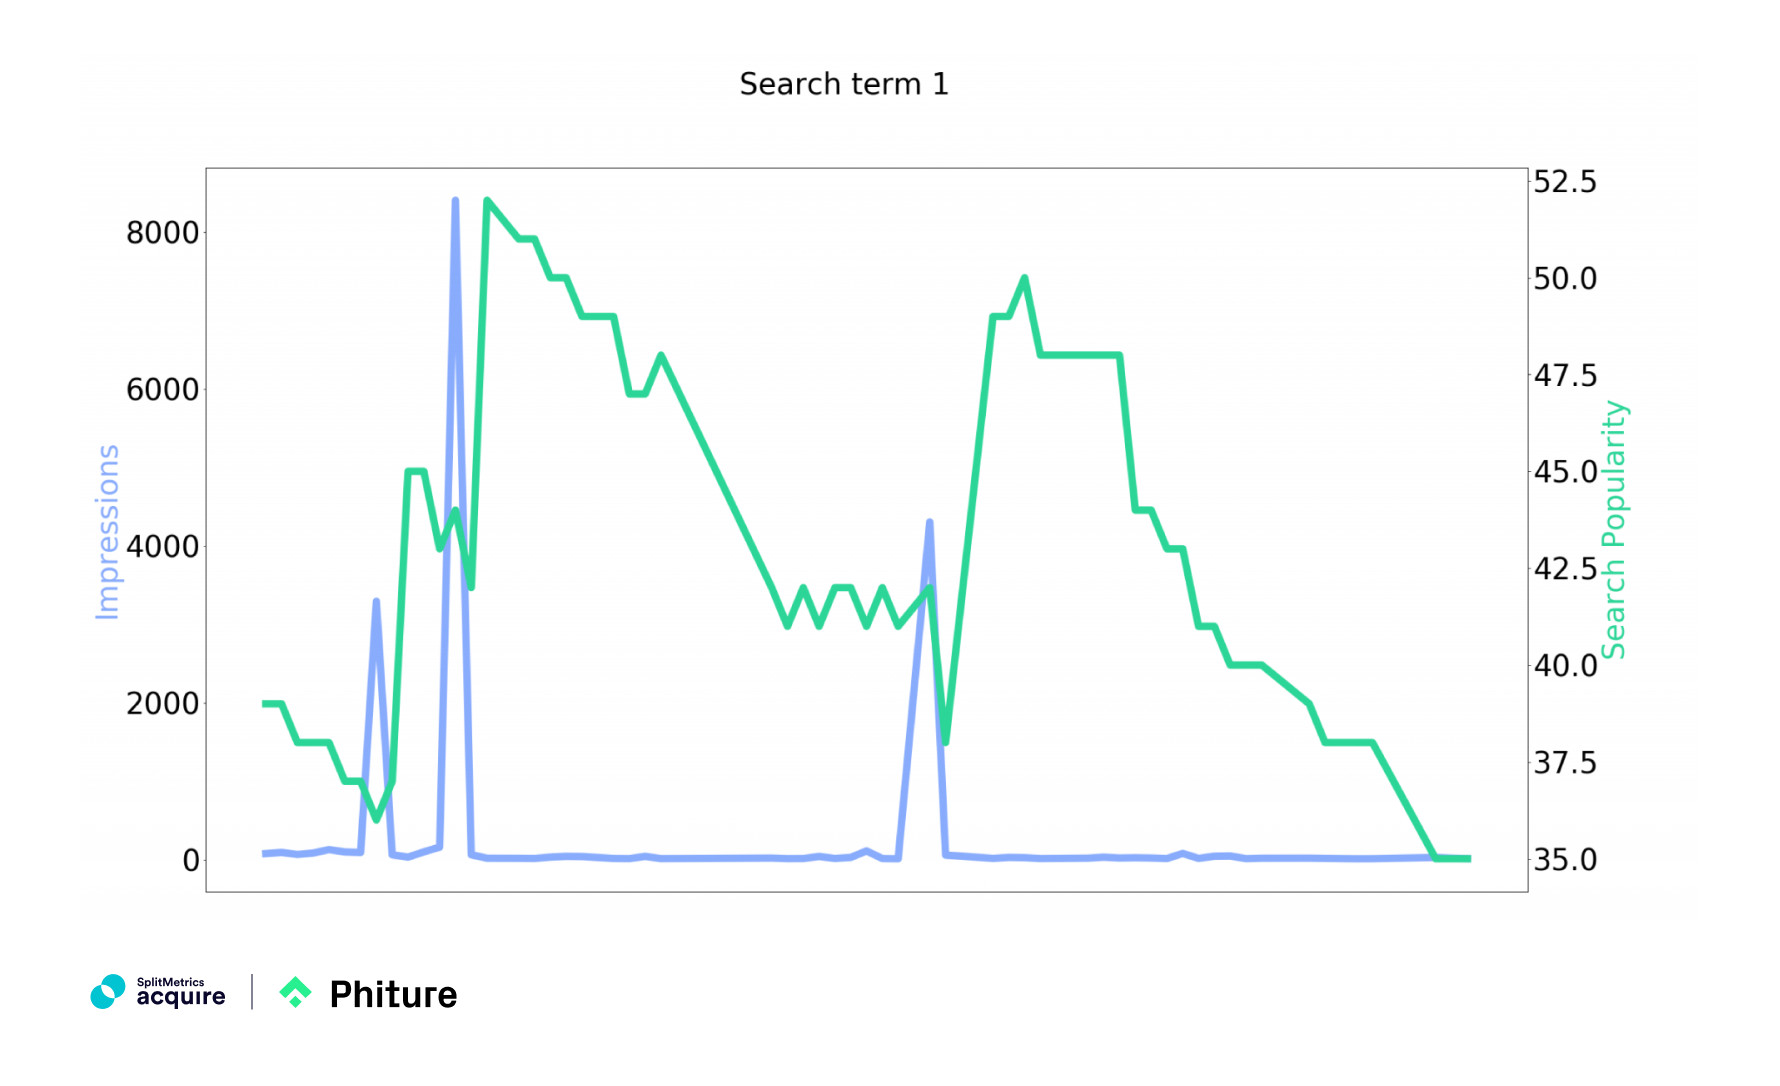
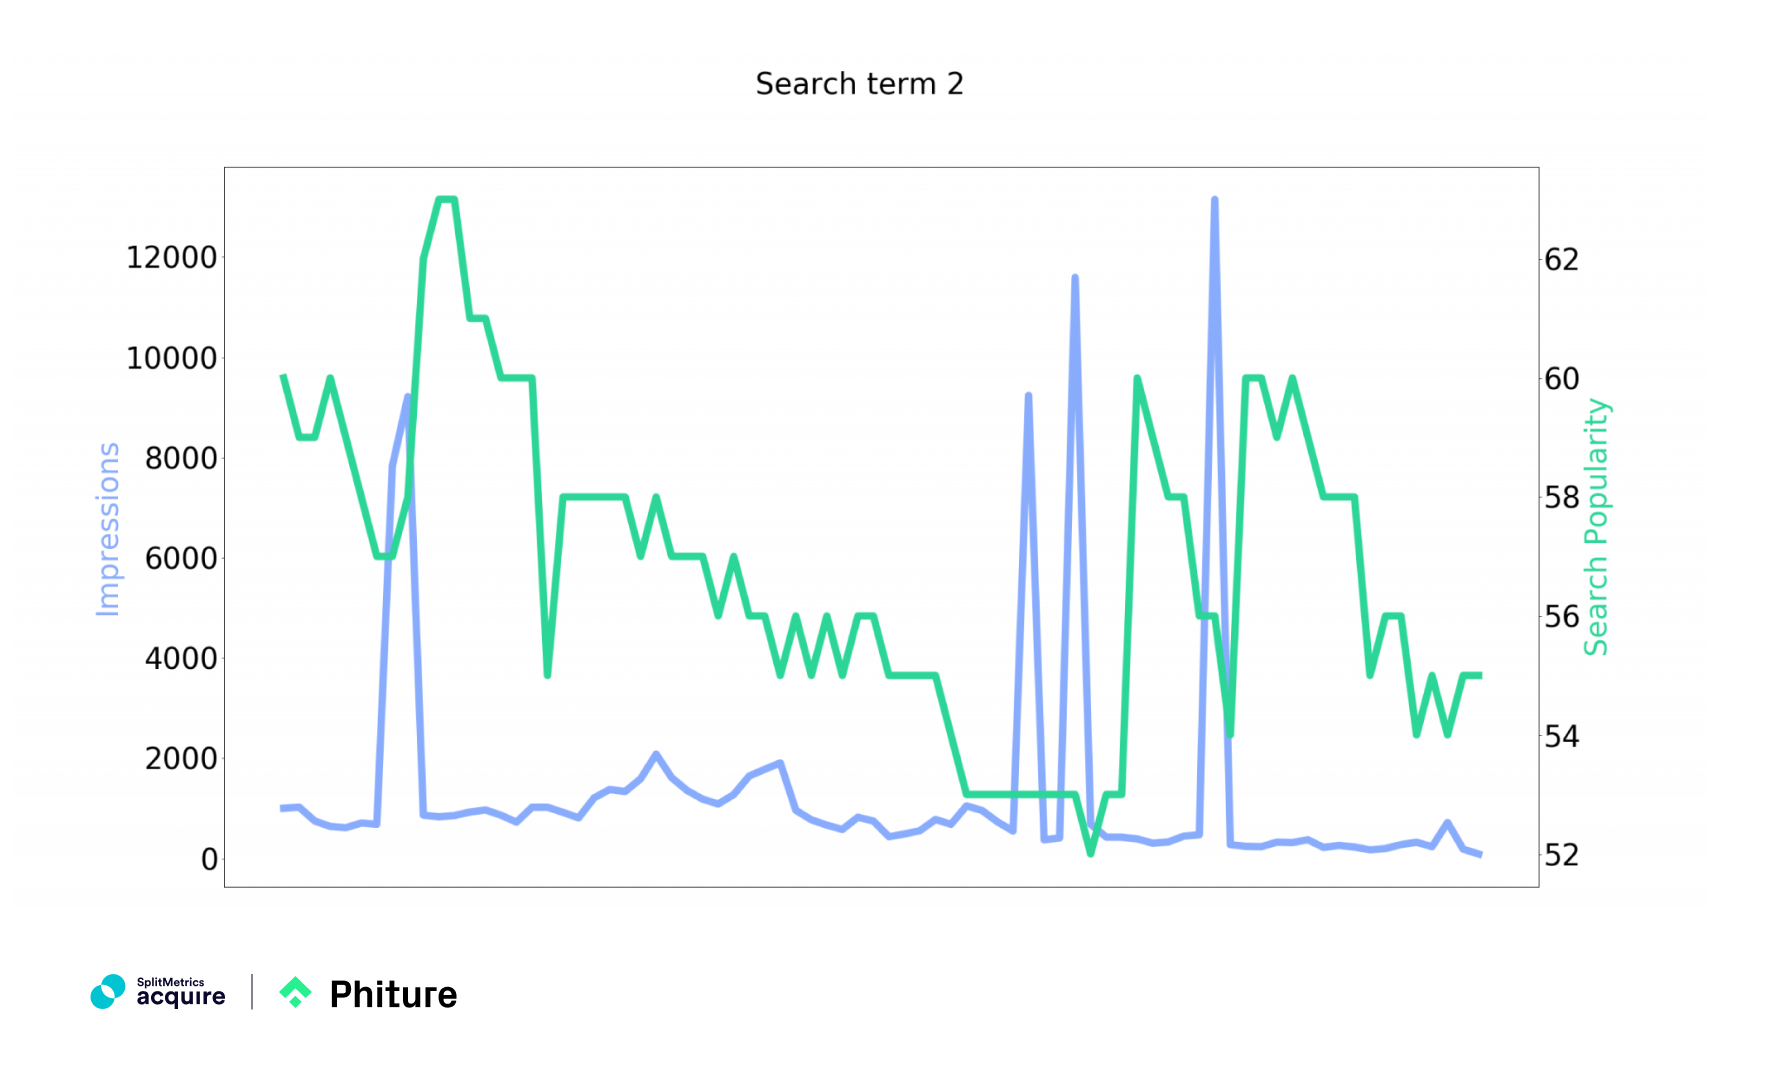
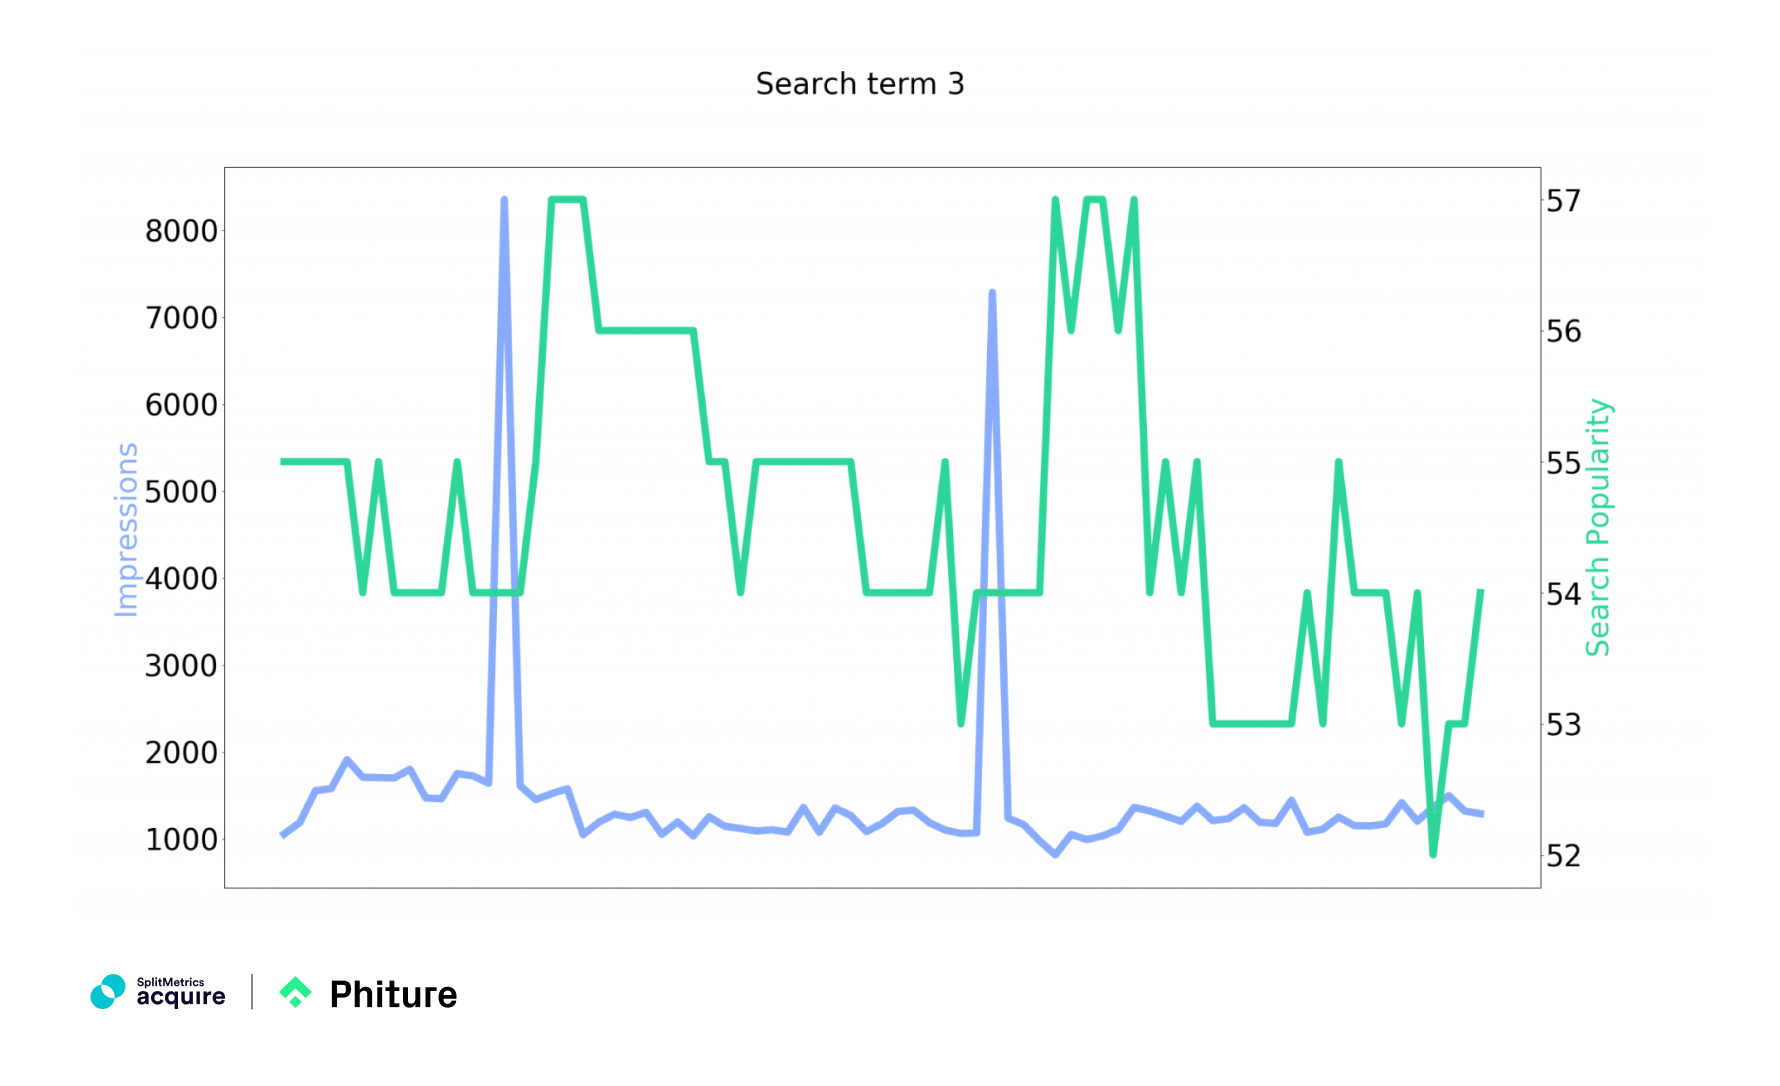
The observations above suggest that for each search term a spike in impressions is followed by an increase in Search popularity shortly after, with a time lag of about 4 days. It is likely that Search popularity is calculated as a moving average of up to 7 days, which is indicated by the adjustment period.
The data obtained up to this research stage are unprocessed, so we can’t rely on them to draw conclusions. Before getting down to the analysis of the obtained data, the data cleaning was performed to eliminate outliers that can lead to a bad fit while building a model.
Knowing about the lag, the Search popularity results were shifted by 4 days:
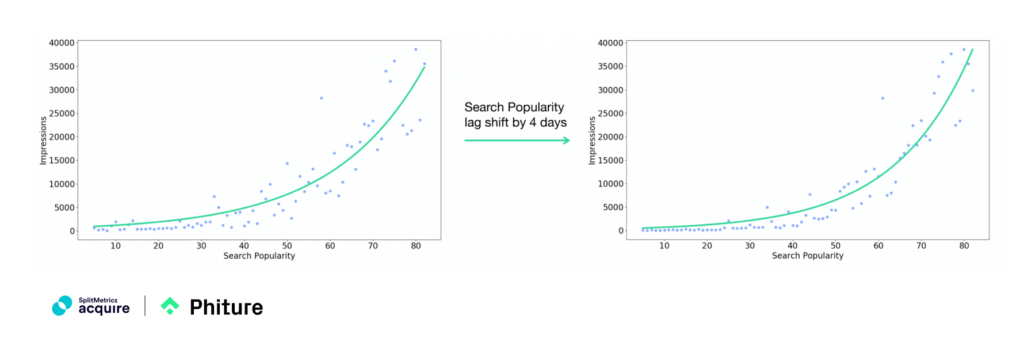
Next, for every Apple Search popularity index unit the search term with the maximum number of impressions per day was picked. Taking the rolling median over three Search popularity scores resulted in a very similar fit and removed the last observations that don’t follow the 4-day lag rule.
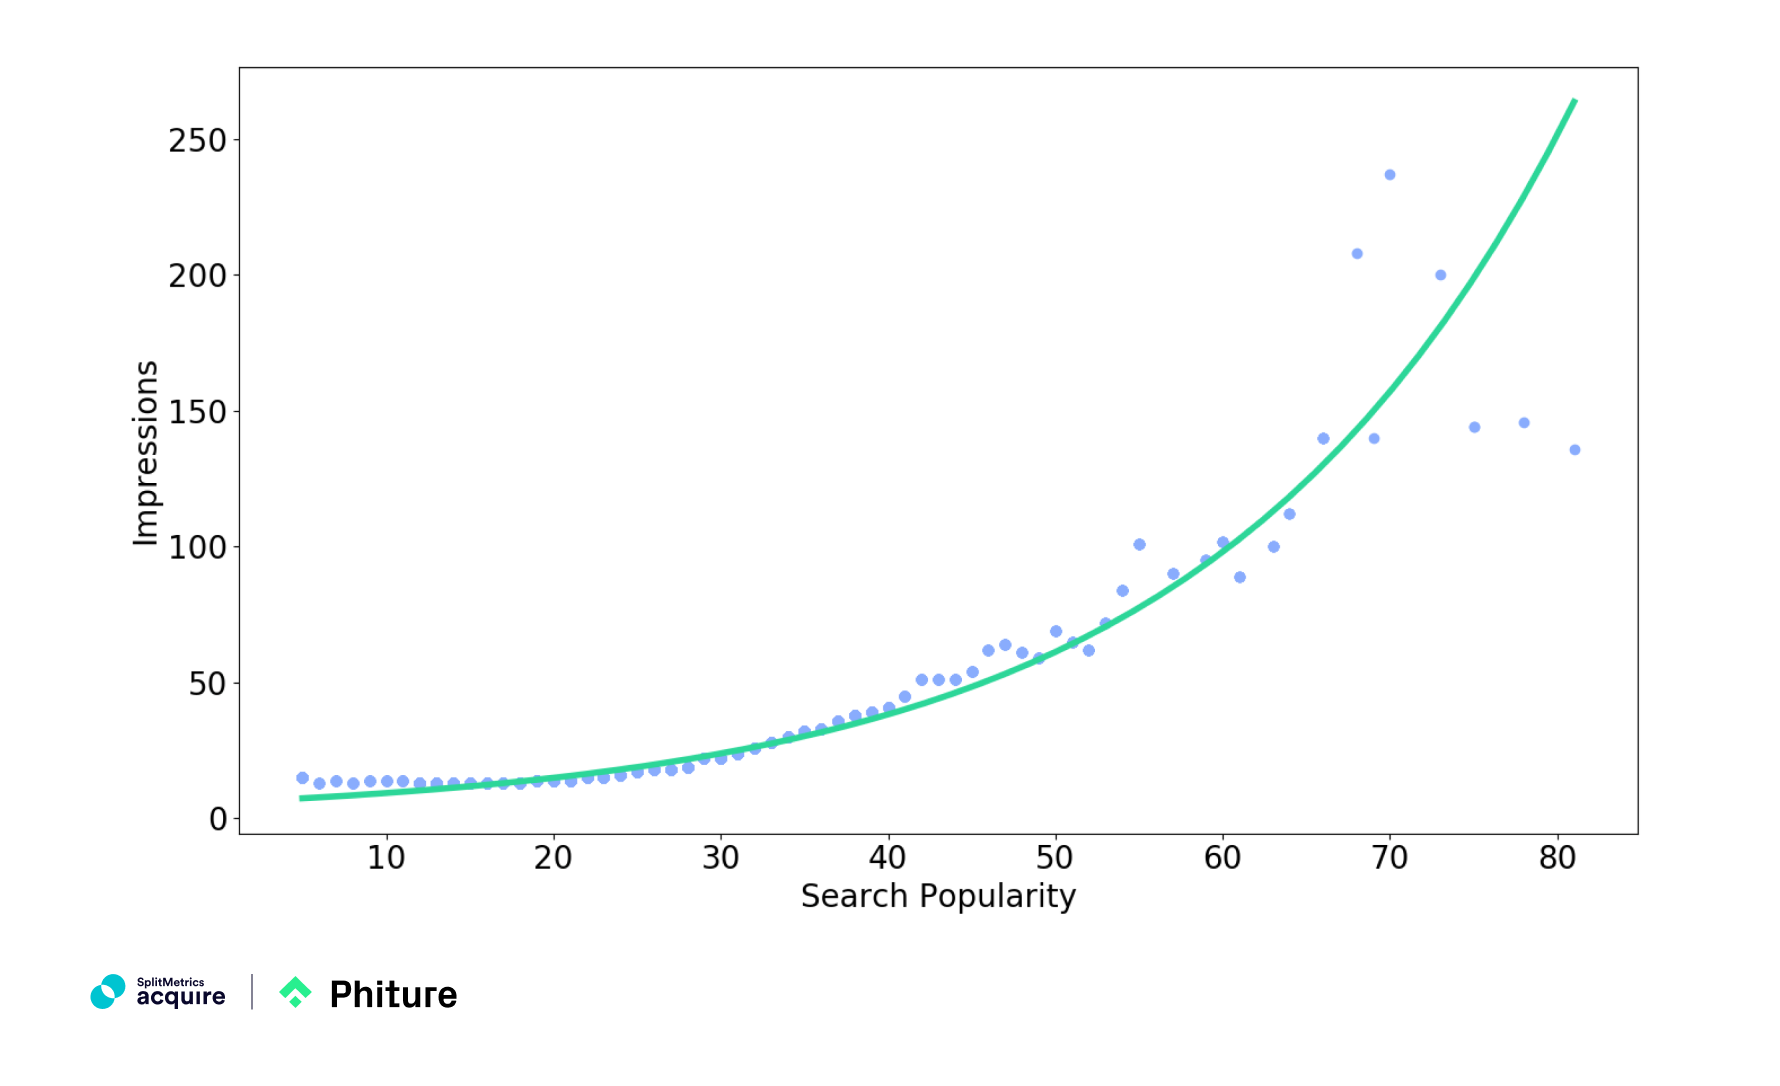
Having removed all the noise, we can see that the collection of data points follows an exponential curve relationship:
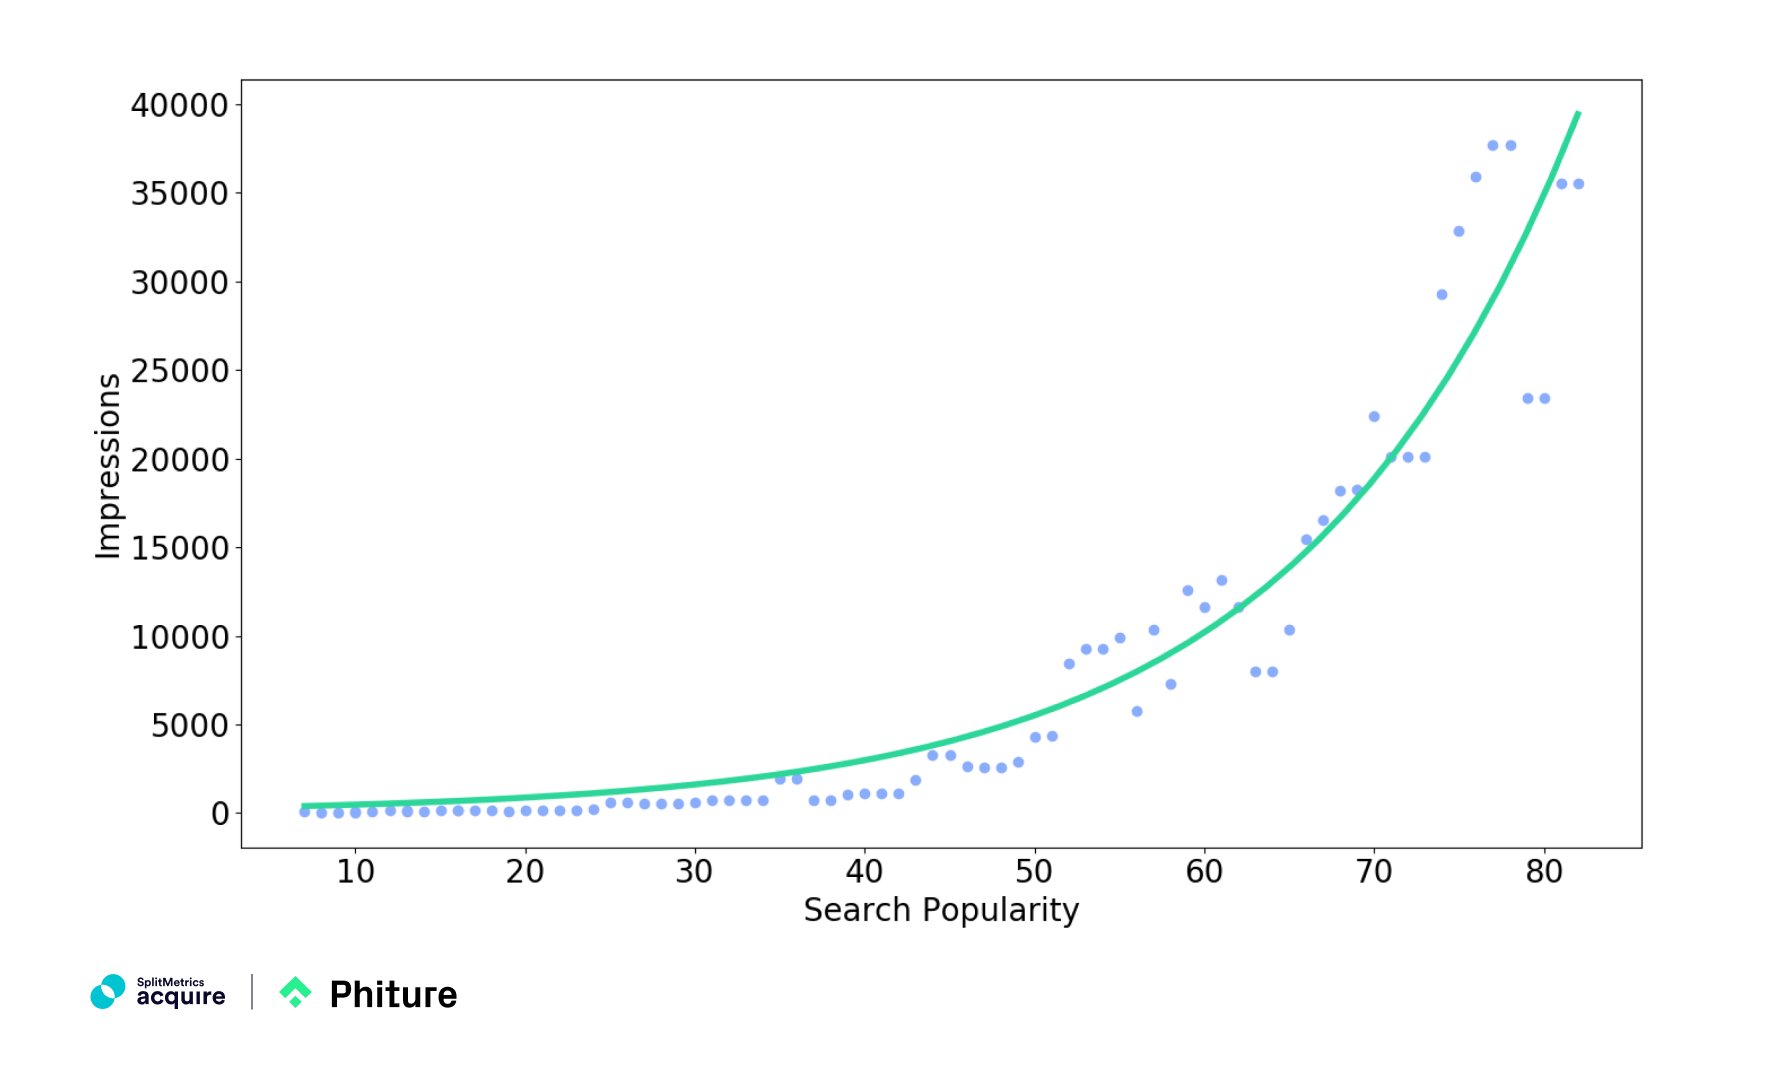
From the analyzed data, Phiture has come up with the formula to calculate maximum impressions for a maximized share of voice in Apple Search Ads:
Max Impressions = 254.4443 * exp(0.0615 * Search Popularity)
By using this formula, it’s possible to estimate the available volume for a keyword if you have its Search popularity available. This helps conclude that, for example:
The exponential relationship between App Store impressions and Search popularity could be caused by the combination of the Search popularity lag and other factors. To verify the results above, we’ve carried out a couple of robustness checks.
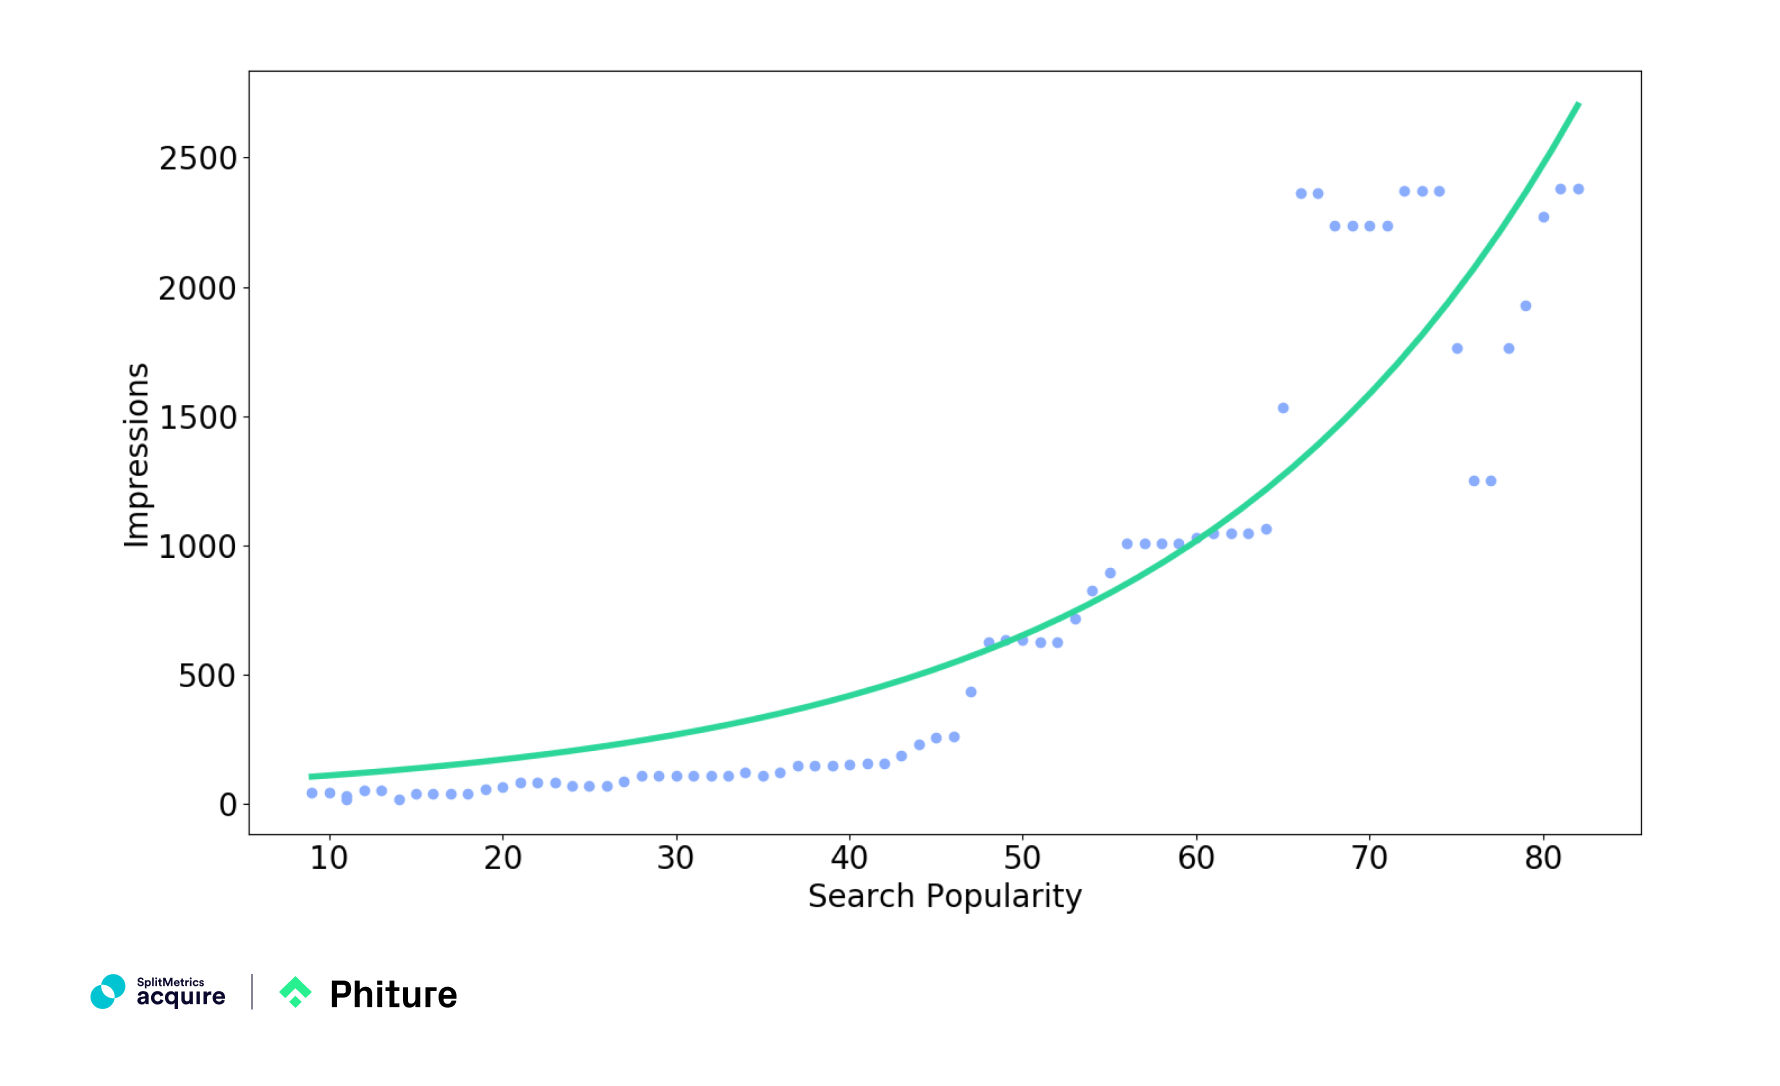
Unlike the average, the median of a large data set eliminates the influence of prominent outliers. By using the raw data and taking the median impressions for every Apple Search popularity index unit we’ve found out the exponential relationship as well:
We’ve applied the same methodology to the data collected from the German storefront, which resulted in a strong exponential relationship as well. The curve, however, lies at lower levels of impressions, which is probably caused by insufficient data for the DE storefront.
Here are our three main tips on using our findings in practice:
The research has revealed that Impressions and Apple Search Ads Search popularity follow an exponential relationship:
From this graph, you can see that a strong exponential increase starts from around the Search popularity of 40. So it makes sense to allocate more budget on keywords with the Search popularity of 40 and above, as they can bring about a significant increase in impressions for a maximized share of voice.
According to our findings, a keyword with the Search popularity of 60 drives 10,000 impressions, while another one with the Search popularity of 82 will result in 4 times more impressions – around 40,000. Thus, by choosing a keyword with even a slightly bigger Search popularity (starting from 40) you can expect a considerable boost in your share of voice.
On the other side, impressions for the Search popularity from 5 to 20 are close to zero, and from 20 to 40 the growth in impressions is hardly seen. So, it’s reasonable to lower bids on keywords with the Search popularity under 40.
We’ve discovered that the maximum number of impressions (in the US storefront) for a Search popularity score can be calculated using the formula:
Max Impressions = 254.4443 * exp(0.0615 * Search Popularity)
By knowing the Search popularity of Apple Search Ads keywords that you already bid on, you can understand the maximum possible number of impressions for a maximized share of voice. If you see fewer than the maximum, you can try increasing the bid depending on your budget. It can be that there’s more volume available for a keyword.
The research has revealed that Apple Search Ads Search popularity lags behind impressions by about 4 days. In other words, the current Search popularity may reflect the App Store keyword search volume of around 4 days ago, while its current impressions may have changed in either direction.
This knowledge may be helpful to ASO practitioners. When you research keywords to put in the title, description and the other metadata, take into account not only Search popularity but also keywords impressions. By doing so, you will make decisions based on the current state of things.
Identifying search terms with a high seasonality is still important since these might bias the results.
For example: “FOX Sports Super 6”, a game that allows to predict the outcomes of sports events and win money, implies a high degree of seasonality. Temporarily, you may see high Search popularity scores. This will make you conclude that the number of App Store impressions is very high, whereas the average impressions throughout the year will be relatively low.
Here, scheduling bids for search terms with a high seasonality will definitely pay off.
Moreover, the peak period when you can benefit from search terms with a high seasonality may last under 4 days. If you rely on Search popularity only, you may miss the opportunities to reach out to users. Pay attention to impressions as well, as they reflect the most actual status of popularity.
That’s it for now. We want to say thanks to Phiture for teaming up on this research. Hopefully, you’ll find the findings insightful, and they will come in useful as you do your Apple Search Ads and App Store optimization.
If you have any questions or feedback on the research, feel free to contact us.