Bayesian Intelligence for Flexible Experiment Management
 Lesia Polivod
  Lesia Polivod
 ASO, growth-, and product managers are looking for a good risk-cost trade-off for their specific domains to validate hypotheses cost- and time effectively.
Higher data credibility and lower acquisition costs are what pretty any app marketer is looking for. It’s particularly true for the top app publishers, large companies, and categories like gaming, where stakes are high, and a mistake is worth a lot.
SplitMetrics Optimize provides three statistical methods within one platform to unleash the fullest potential of A/B/n experiments before, during, or after the app launch.
The Bayesian method has become a leading solution for the growth hacking environment.
That’s why it’s a prevalent method for many ASO, product, and marketing leaders.
SplitMetrics Optimize focuses on the best UX, so we implemented Bayesian Intelligence for safe and cost-effective experimenting.
Eliminate risk and improve the efficiency of the A/B testing experiments for your mobile games and apps. Exploit the advanced solution to improving risk control.
The Bayesian approach in SplitMetrics Optimize is beneficial due to indirect control over the risk. Hence users can control the expected loss-stopping rule (threshold of caring).
The stopping rule – stops the test to save budgets once the winner or underperformer is obvious.
An early stopping rule by SplitMetrics Optimize is implemented via the expected loss. If an obvious winner is defined or the test seems futile, an early stopping rule will detect it automatically and stop the experiment before you waste traffic.
This approach determines how many conversions you may lose if you stop the test immediately and roll out the leading variation. The algorithm stops the test when your possible losses get low enough for an acceptable risk rate.
Let’s take the example of expected loss
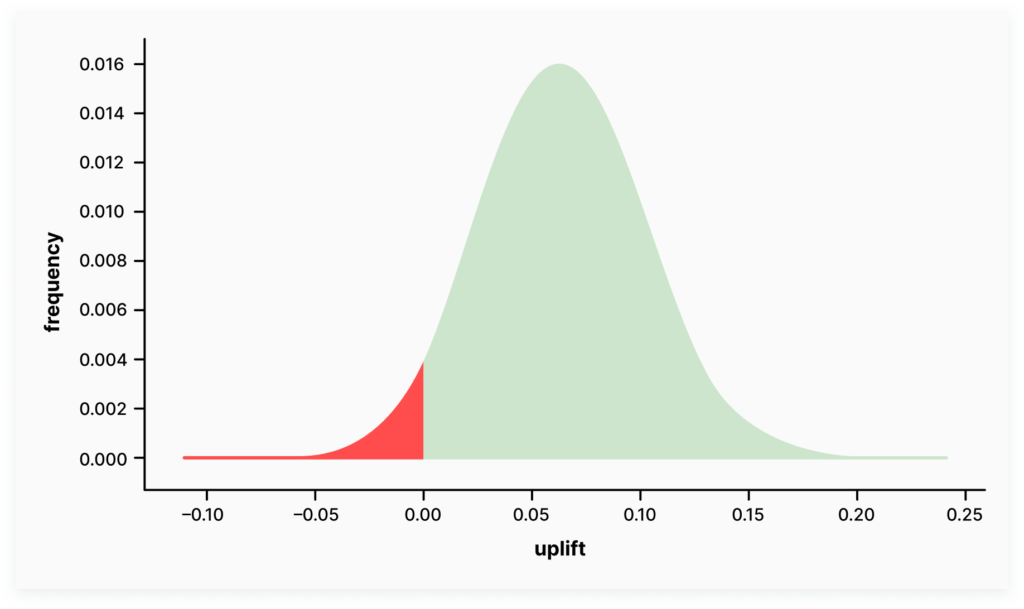
Variant B (CVR = 0.29) is tested against variant A (CVR = 0.22), each getting 300 visitors so far.
The top variant (B) uplift is the difference between B’s and A’s conversion.
The uplift is a hat with a left tail slightly crossing the below-zero zone. The negative part of the uplift curve is our possible loss zone, in case we stop the test right now and roll out the B variant.
The expected loss is in the area of this loss zone. It is the sum of the possible losses (minus 0.001, minus 0.002 .. minus 0.1) weighted with their respective probability.

The expected loss is determined by absolute values. Practically speaking, the risks in experiments with low and high conversion rates are different. With a low CVR (about 2-3%), the risks for an experiment are higher, while with a higher CVR (about 26-40%), we tend to be too conservative and spend more traffic to get reliable results. Technical explanation of the expected loss-stopping rule concept.
Let’s consider the following example
In the case of the average CVR = 25% and expected loss =5%, this expected loss threshold is adequate (2% of the current CVR). If we apply an expected loss of 0.5% to CVR =5% – the possible expected loss threshold can be about 10% of the current CVR. The risks might be too high to be acceptable for most business cases. Hence, we recommend considering different expected loss rates according to your CVR.
At SplitMetrics Optimize, we automated this time-consuming and tedious process for you.
The platform automatically calibrates the expected loss threshold according to the projected CVR level.
Bayesian Intelligence keeps the risk/cost ratio the same for different conversion levels.
Choose a cost-effective and flexible solution for your mobile app experiments in SplitMetrics Optimize.
