Apple Ads — 15 Oct 2026
Apple Ads Guide: From Beginner to Expert (2025)
 SplitMetrics


Apple Ads is a powerful advertising platform that allows app developers and marketers to promote their iOS apps directly within the App Store. Its strategic value lies in its ability to reach highly engaged and valuable users across various stages of their app discovery journey. For this purpose, it utilizes multiple ad placements and benefits from a unique interrelationship with app store optimization (ASO).
Rule-based automation and portfolio-level AI bidding work through management platforms and SplitMetrics Acquire provides both.
If you’re a beginner or entirely new to Apple Ads, start your journey here to become an expert and grab some of our unique insights on optimization, automation, and AI along the way.
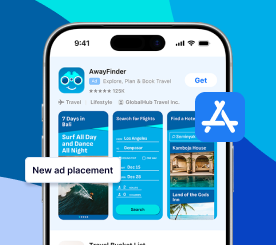
Apple Ads is an advertising platform functioning within the App Store. It offers four ad placements, allowing users to connect throughout different stages of their app discovery journey.
Always refer to Apple Ads documentation for technical data and specifications. This article is solely for understanding Apple Ads strategy, optimization, and efficient management.
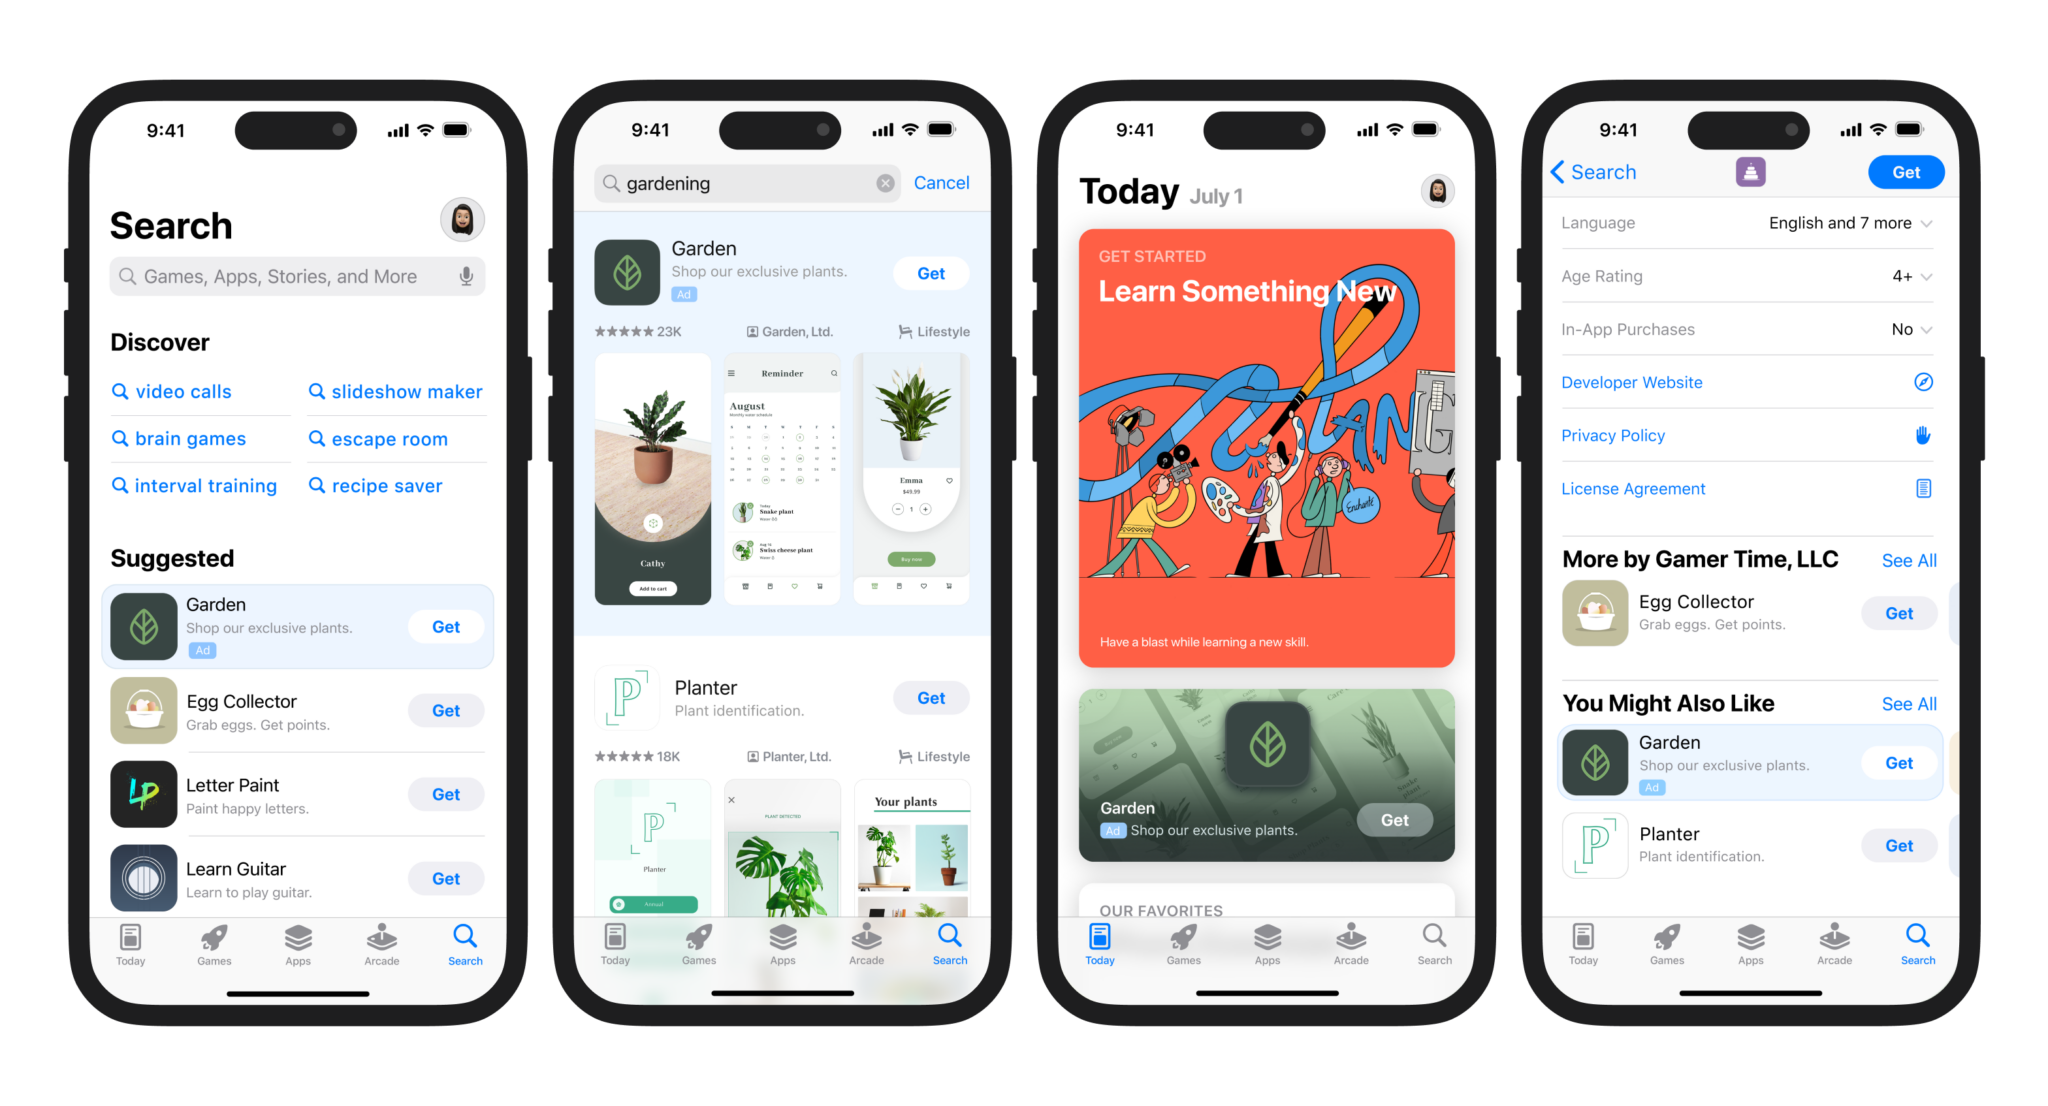
Search results ads are displayed in search results, addressing countless search queries of App Store users. It’s the most popular placement, a critical source of downloads. Search results ads are created from default product page assets. Advertisers can create ad variations based on custom product pages, enabling users to have a more relevant experience.
Today tab ads appear on the Today tab and are viewed by over 800 million users every week. They have the potential to increase your brand awareness and influence the performance of other placements. They have a unique design and always have a custom product page as their target destination.
Search tab ads appear on the Search tab before a user initiates a search. Like Today tab ads, search tab ads have an immense potential for impressions, as most users use the search feature to discover new apps. They also may utilize custom product pages as target destinations.
Product page ads appear on product pages of similar apps in the “You might also like” section. They can potentially increase app downloads, taking them away from your competitors, because users scrolling through product pages tend to be more engaged than others.
Each ad placement in Apple Ads connects with users at different journey steps. If you’re a beginner, you’ll most likely begin exploring Apple Ads with search results ads. However, it’s highly recommended that additional formats be included with the expanding budget to take full advantage of their synergy.
The advantage of multi-placement advertising in Apple Ads is the positive effect ads may have on each other’s performance. Increasing the number of touchpoints with a user exploring the App Store may lead to improved conversion rates in search results and a higher volume of branded search terms.
Apple Ads uses the second-price auction model, meaning advertisers have to bid for impressions of their ads, controlling how much they’re willing to spend through the maximum CPT bid parameter and daily budget settings. However, the platform charges advertisers only for taps, regardless of generated impressions.
In a second-price auction model, the winner (the advertiser with the highest bid) pays only a fraction more than the second-highest bidder’s bid. This encourages advertisers to bid their true maximum value without fear of overpaying.
The platform’s auction algorithm determines which ad wins the impression based on a combination of bid value and relevance. A highly relevant ad with a lower bid can sometimes outrank a less relevant ad with a higher bid, capturing a higher impression share for a particular keyword or placement.
Money spent isn’t the only factor determining the likelihood of an ad being shown, regardless of placement. Ad quality and product page quality are crucial factors because they directly influence an ad’s tap-through and conversion rates, which are key signifiers of them being matched with user intent.
This is the primary reason why App Store Optimization (ASO) is the foundation of any successful Apple Ads campaign. The right creatives, including an app icon, screenshots, a preview video, and a name, will increase your conversion rates. We are confident that the algorithm treats this as evidence of an app worth advertising.
Apple Ads connect advertisers with highly motivated users who are already searching for apps. Our own internal campaign data shows that some categories hace really impressive average CR, exceeding 75% (Entertainment).
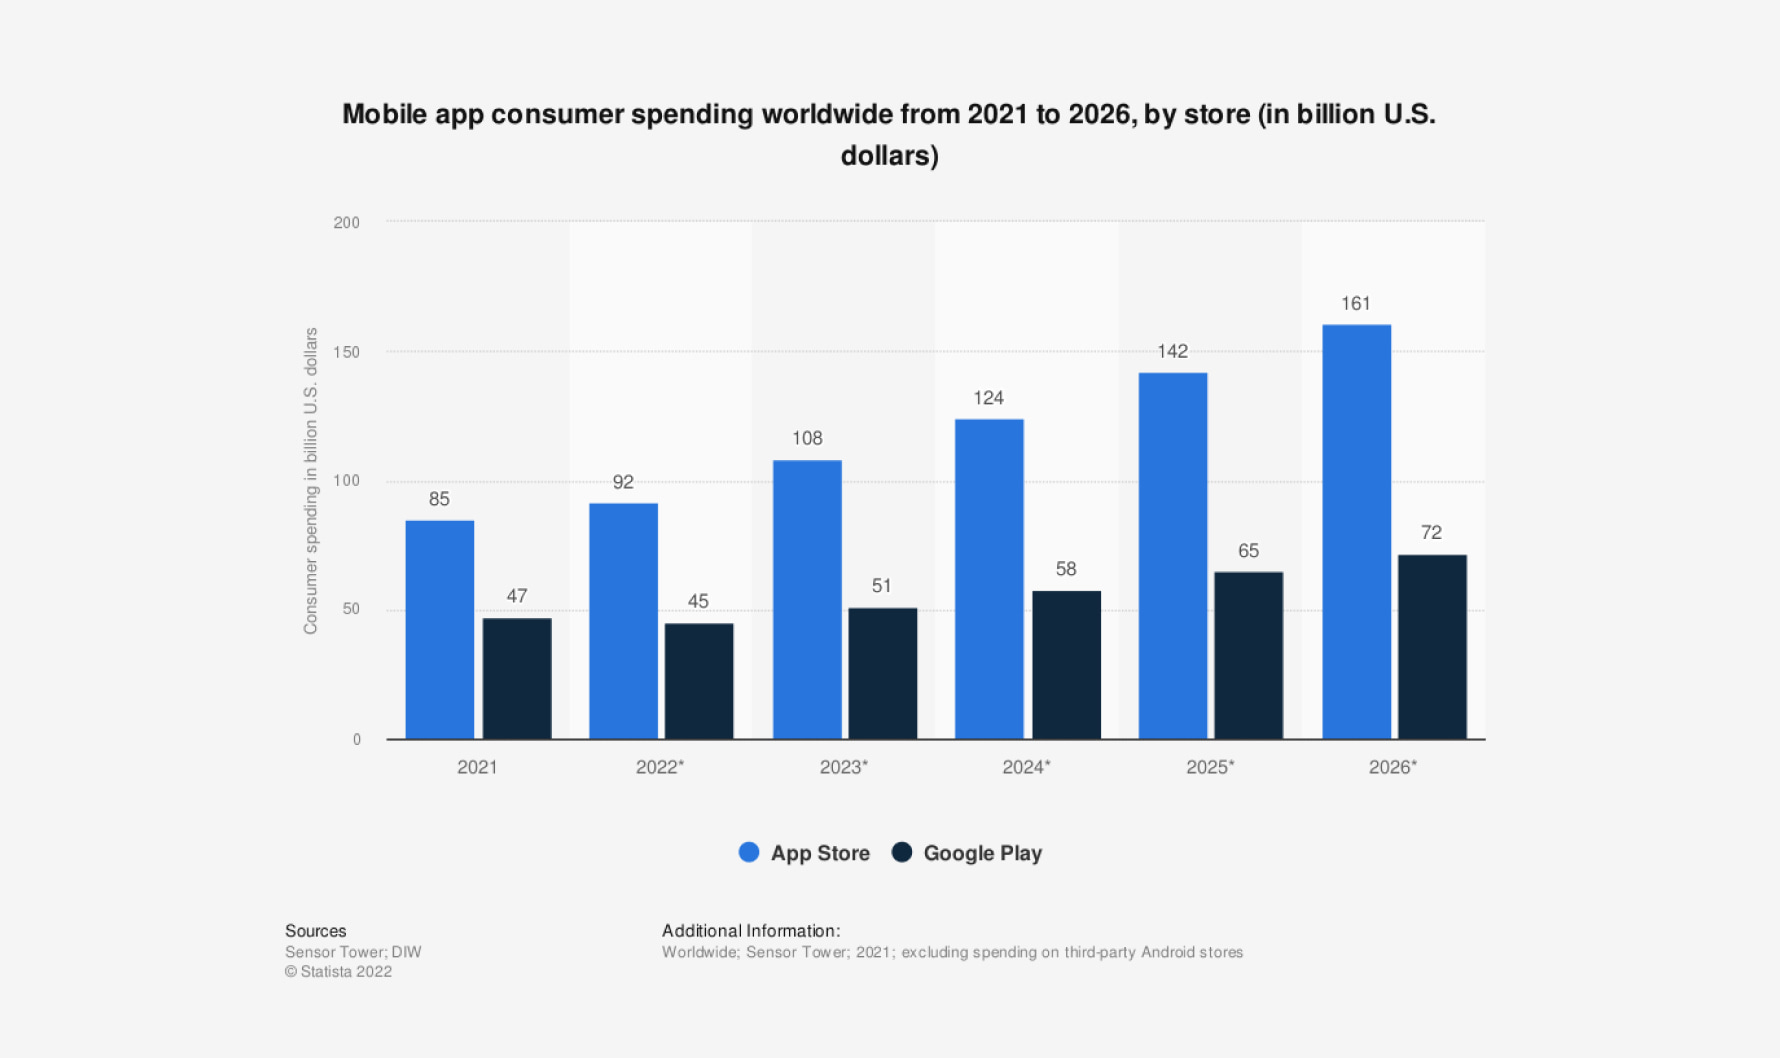
For context, according to Statista figures, users on the App Store generate half the downloads Google Play users do but more than twice the revenue. Even more, App Store users are much more likely to join paid subscription plans than Google Play users, with the average CPA for iOS users being close to 40% lower compared to Android ones for that type of monetization.
Even more, analyzing the performance of apps from various categories, we found that the same app can have significantly and consistently higher retention rates on iOS than on Android, as shown in the table below.
| LTV | 0D | 1D | 7D | 14D | 30D | 45D | 60D |
| iOS | $0.3937 | $0.4447 | $0.6065 | $1.24 | $2.23 | $2.68 | $3.17 |
| Android | $0.0086 | $0.0093 | $0.0112 | $0.0129 | $0.0129 | $0.0142 | $0.0162 |
To summarize, Apple Ads can be a highly profitable advertising channel. Provided strategic optimization, it’s capable of delivering significant return on investment (ROI).
Apple Ads is available in two versions: Apple Ads Basic and Apple Ads Advanced. Before we explain the workflow, optimization, and management scope, it makes sense to explain the difference between them.
Apple Ads Basic is a fully automated advertising platform that allows for an easy start and effortless campaign running. The algorithm handles all optimization within the designated budget. The platform introduces several restrictions regarding the number of promoted apps and maximum spend.
Apple Ads Advanced gives you complete control of your ad campaigns and offers many more options and insights into their performance.
The free SplitMetrics Acquire Starter Plan connects with your Apple Ads Advanced account through API to provide an additional layer of functionality for improved management, automation, reporting, and optimization. It will give you a high degree of automation for Apple Ads Advanced, significantly reducing your workload and, at the same time, giving you all the optimization flexibility to make this marketing channel simply work and be profitable.
Apple Ads Basic vs Advanced is one of the most common dilemmas app developers initially have. We highly recommend going for Apple Ads Advanced from the start for better optimization, optimized spending, etc. However, should you want to learn more about how these platforms differ and when each might be the best choice, we’d like to direct you to this article:

The cost of Apple Ads campaigns reflects the potential return on investment on the platform, a critical factor that incentivizes competition to pursue high-LTV users on the App Store. Here are the primary factors influencing it:

In this context, we must understand the Apple Ads metrics. This is the final step before we proceed to planning our campaigns.
Apple Ads includes the following metrics: Average CPA, Average CPM, Average CPT, Average Daily Spend, CR, Dimensions, Impression Share, Impressions, Installs, Match Source, New Downloads, Rank, Redownloads, Search Popularity, Search Term, Spend, Taps, TTR.
The critical Apple Ads metrics for planning and evaluating campaigns are cost per acquisition (CPA), cost per tap (CPT), conversion rate (CR), and tap-through rate (TTR). Consequently, we provide benchmarks for them, either online on our Benchmarks Dashboard or with an in-depth analysis of cyclical benchmark reports (based on our campaign data).
View-through metrics can be a powerful tool for understanding the full impact of your Apple Ads campaigns. They are beneficial for measuring the “halo effect” of your advertising—the installs that are influenced by an ad impression, even if there was no direct tap.
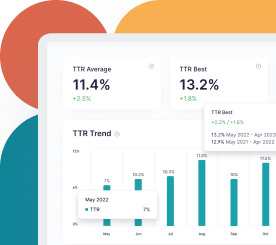
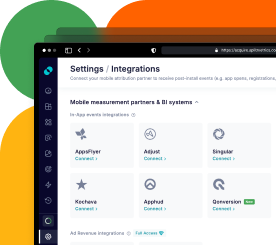
Connecting a mobile measurement partner (MMP) with Apple Ads campaign data will unlock new, full-funnel, revenue-focused campaign optimization opportunities for your mobile app or game. It’s essential to capitalize on the previously mentioned value of Apple Ads to connect with high-LTV users efficiently.
MMP integrations allow us to introduce multiple “goal-centric” metrics for users performing those activities, such as the average cost per goal (CPG) or simply the volume of goals. Given that goals have been assigned a monetary value (based on your app monetization plan), our platform can easily analyze additional metrics, such as return on ad spend (ROAS).
After we’ve covered the basic concepts, let’s get to campaign planning. The first step is to choose the right Apple Ads campaign structure.
An account structure orders your keywords, ads, and search terms into multiple campaigns containing different ad groups in Apple Ads. Today tab ads, search tab ads, and product page ads always have their dedicated campaigns. Search results ads require structuring to consider their themes and value, influencing CPT bids and spending.
For search results ads, it’s essential to categorize keywords because, depending on their theme or value, they may require different bidding strategies or analytical approaches.
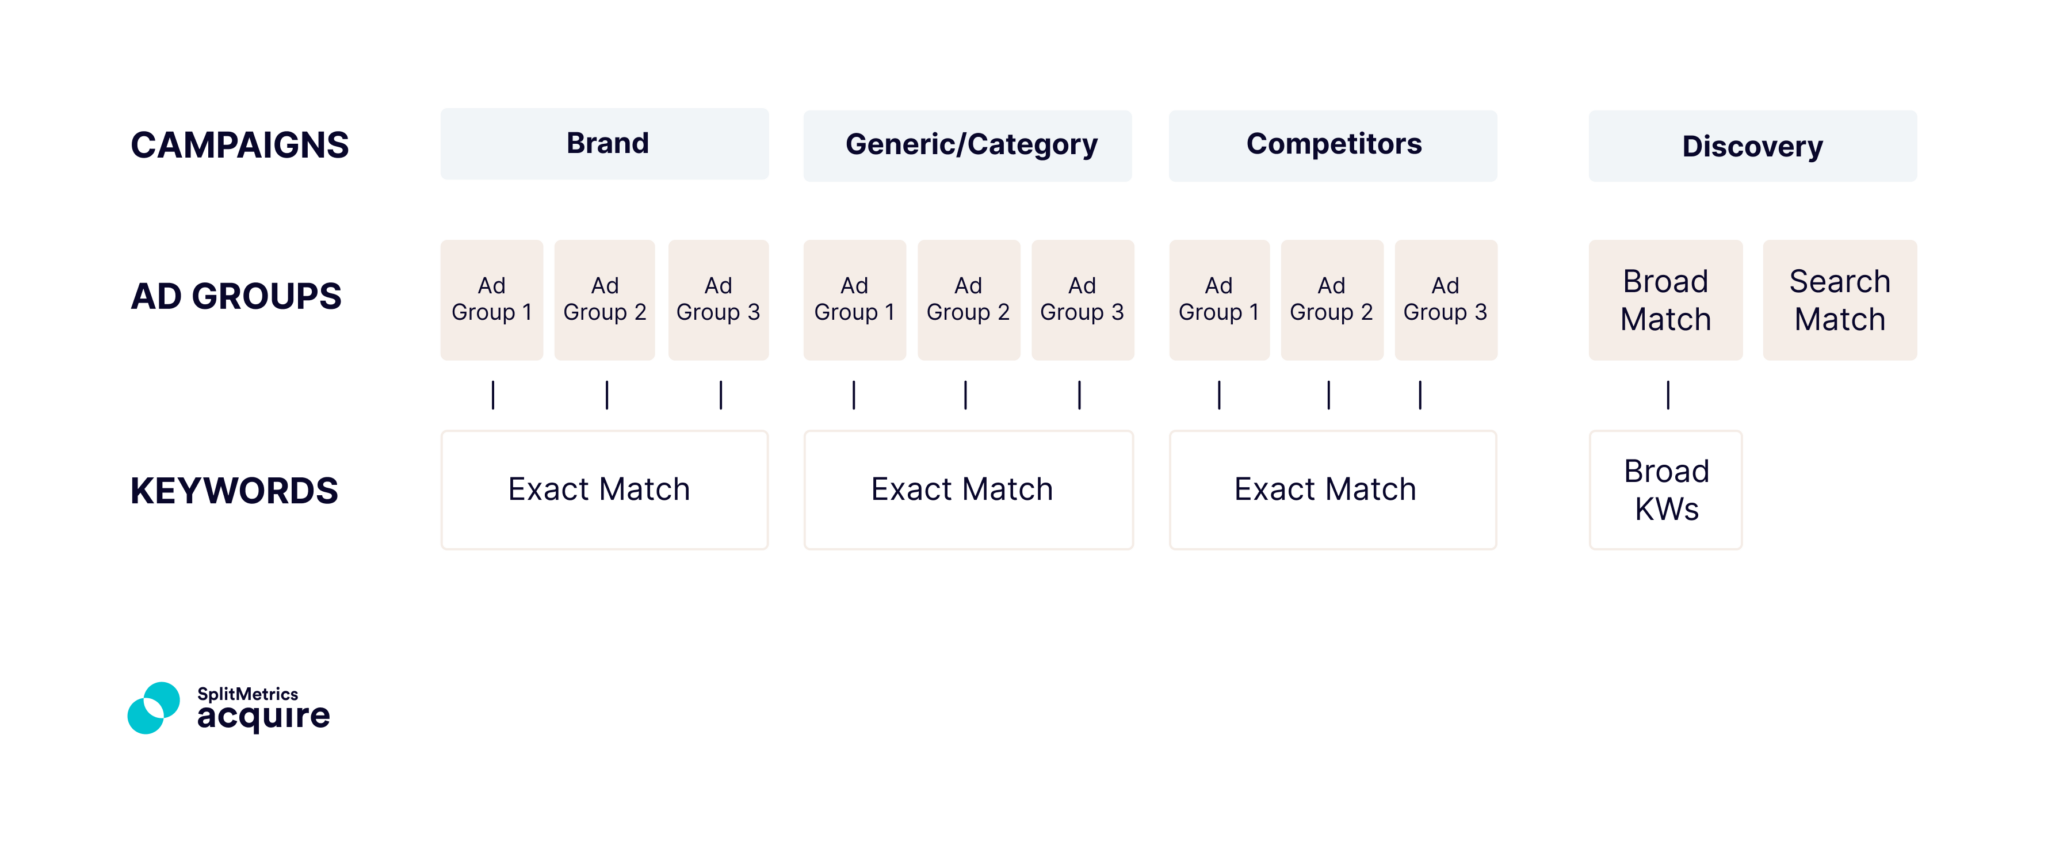
If you’re a beginner, you’re most likely to use the semantics-based account structure for search results ads recommended by Apple Ads for your search results ads, with possible additional campaigns for the other three placements. There’s also a value-based account structure, but given this article’s introductory character, we’ll focus on the semantics one. Anyway, should you desire to learn more about the topic, we recommend starting here:
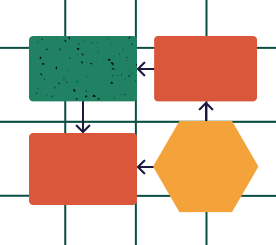
Regardless of the chosen account structure, whether prioritizing value or theme, being more granular or simple – you’ll always run the following types of campaigns.
Three of the four ad placements, search tab ads, product page ads, and Today tab ads, occupy their separate campaigns with their dedicated budgets and specific targeting options.
Search results ads in Apple Ads address many search terms introduced by App Store users. Because of this, they require a more nuanced and elaborate approach. First, let’s introduce some basic terminology related to the components of these campaigns and Apple Ads match types.
Campaigns contain ad groups and define the daily budget and target markets.
Ad groups contain keywords, search terms, and ads. Targeting and bids are set here.
Search terms are search queries submitted by the App Store users.
Keywords are words or phrases that you, as an advertiser, bid on.
Ads are ad variations, selected keywords leading to custom product pages.
Exact match shows ads to precise versions of keywords for best profitability.
Broad match will show ads to relevant variants and phrases for best reach.
Search Match algorithm shows ads automatically for relevant search terms.
Brand, Competitor, and Generic campaigns are optimized for user acquisition and maximum profitability with exact match type. Discovery campaigns are geared for maximum reach, with broad match type and Search Match feature turned on.
Brand campaigns in Apple Ads contain keywords directly associated with your brand, such as the name of your app or publisher. They’re highly valuable and profitable, being displayed by users looking specifically for your app. Unattended, they can lead to competitors capturing part of their attention.
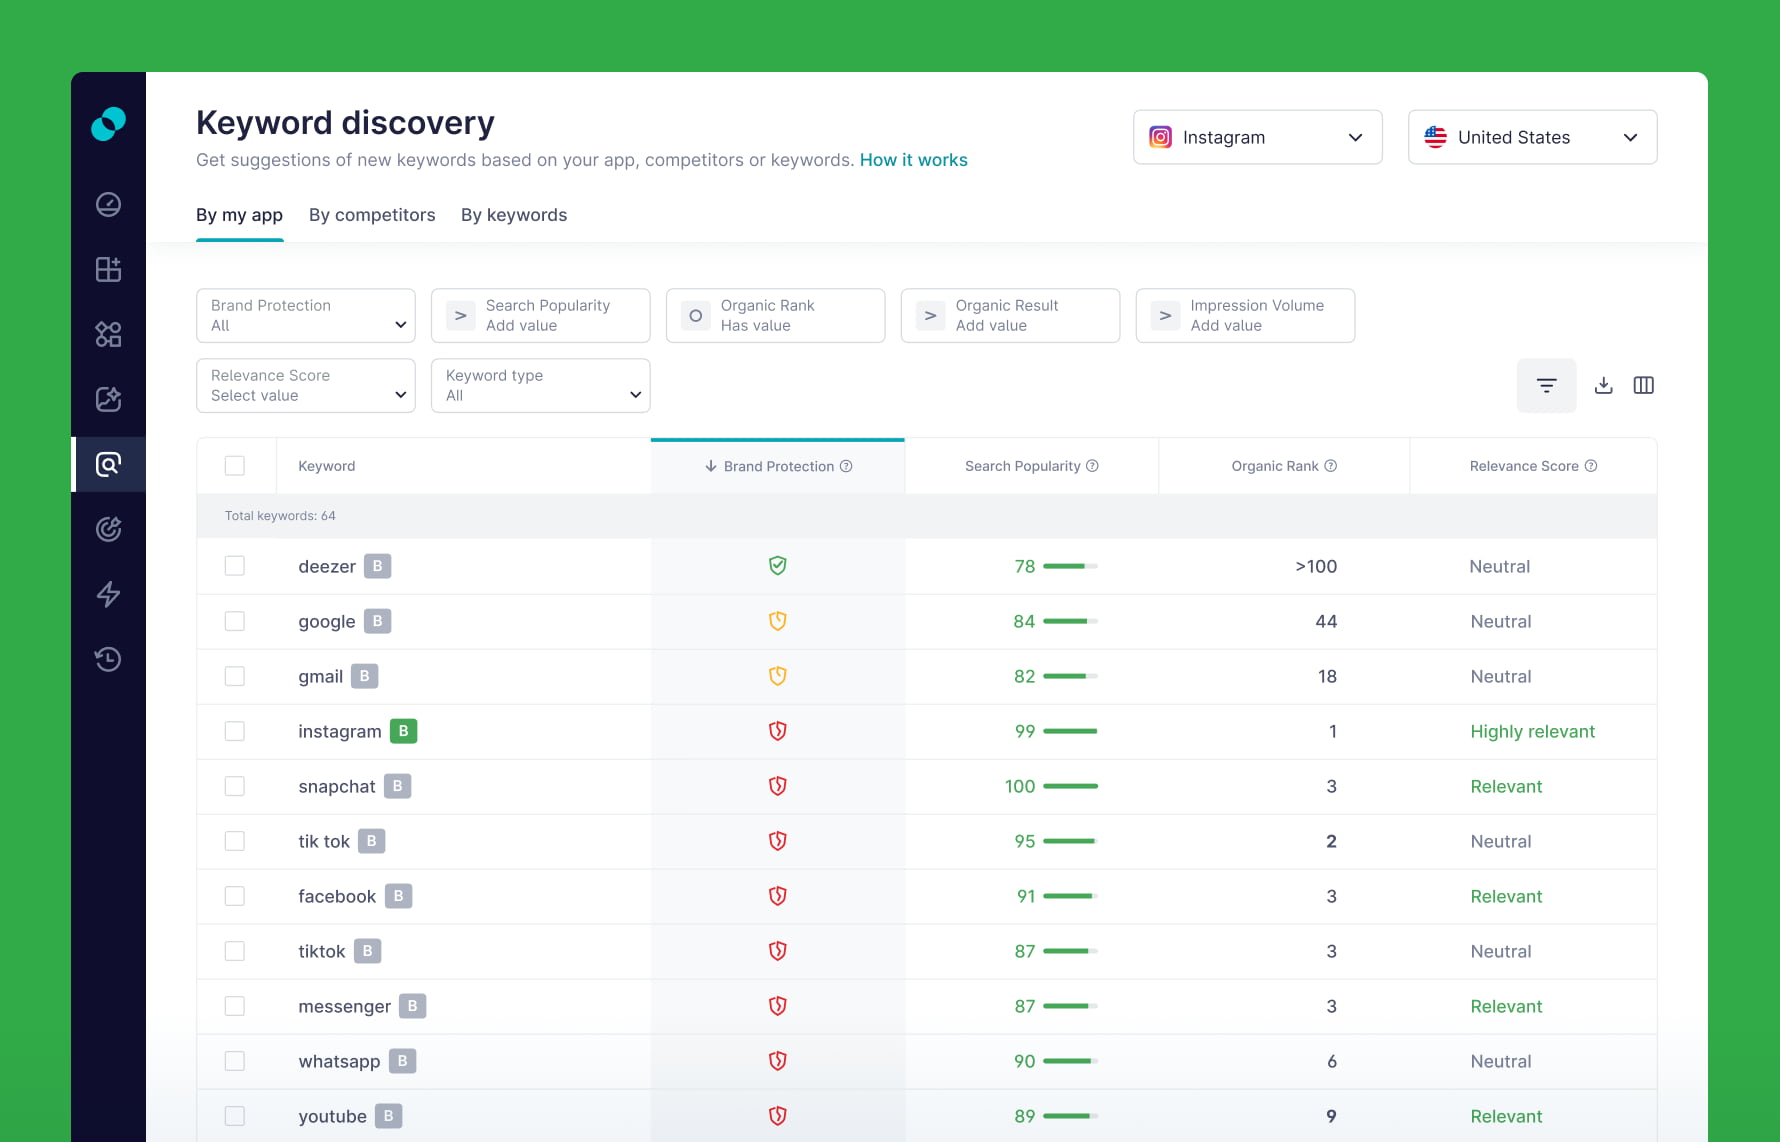
Competitor campaigns in Apple Ads are closely connected to Brand Campaigns. Using the brands and names of your competitors and their variations, you can get installs from users who came to the App Store looking for your business rivals. Brand Campaigns support your defense strategy, while Competitor Campaigns reinforce your offensive efforts.
Category campaigns in Apple Ads should include non-branded keywords relevant to your app’s features or category. The primary goal of Generic Campaigns is to reach users browsing the App Store in search of an app like yours. Such campaigns are highly relevant and reach a broad audience, giving you more impressions than Brand Campaigns.
The primary focus of Apple Ads discovery campaigns is to find new performant keywords targeting your most popular and relevant search terms. These campaigns reach a vast audience, boast many impressions, and attract new customers. They utilize the broad match type to find more variants of your best-performing exact match keywords and the Search Match feature to deliver new keyword ideas based on found search terms continuously. To better understand these campaign types, please refer to the article below:

To understand the workflow and workload related to Apple Search optimization, you need to understand the full scope of optimization. Remember that these apply to search results ads in every case, while other placements – Today tab ads, search tab ads, and product page ads campaigns can be optimized solely by adjusting their targeting.
Additionally, this list doesn’t include conversion rate optimization, as it’s within the scope of app store optimization (ASO). This article also discusses the synergy of ASO and Apple Ads later.
Keyword optimization is a key aspect of Apple Ads Optimization. For the complete keyword workflow – discovery, organization, negatives and bid reviews – read our Apple Ads keyword management guide.
Keyword discovery and selection ensure that the best-performing keywords are prioritized in user acquisition while irrelevant ones are removed from the keyword pool. It should be a continuous process to address seasonal events or changes in the competitive landscape that impact the search terms people use on the App Store.
Optimization of Apple Ads keywords focuses on finding the right ones for your app or game—those that are highly relevant and, at the same time, viable to bid on financially. It’s no easy task, which is fully explained in the following article:

Monitoring of keyword performance is also a critical aspect of keyword optimization. The best-performing keywords should be moved to designated campaigns with exact match type and specified bids to ensure maximum impression share and traffic, and those that don’t meet our expectations should be paused.
In Apple Ads, this aspect of the keyword optimization process is inherently tied to the campaign structure of your choice, and its principles (with visual examples) are provided in the article on the semantics-based account structure.
Strategic Apple Ads bidding is crucial to maintaining profitability on the advertising platform. In essence, bid optimization involves:
Mastering bidding in Apple Ads means knowing how frequently should we change bids on our keywords or ads and how significant should each change be. Succeeding requires systematic, diligent monitoring of key metrics and swift, data-driven actions.
The potential gains when done right incentivize more advertisers to cede bidding to AI, capable of making 10x more bid adjustments to a single keyword in the same period than manual changes, an advantage over even the most sophisticated automation-rule configurations.

Custom product pages are additional versions of your default product page on the App Store, introduced through App Store Connect. They can offer customized screenshots, promotional text, and video app previews, sharing the app icon with the default page.
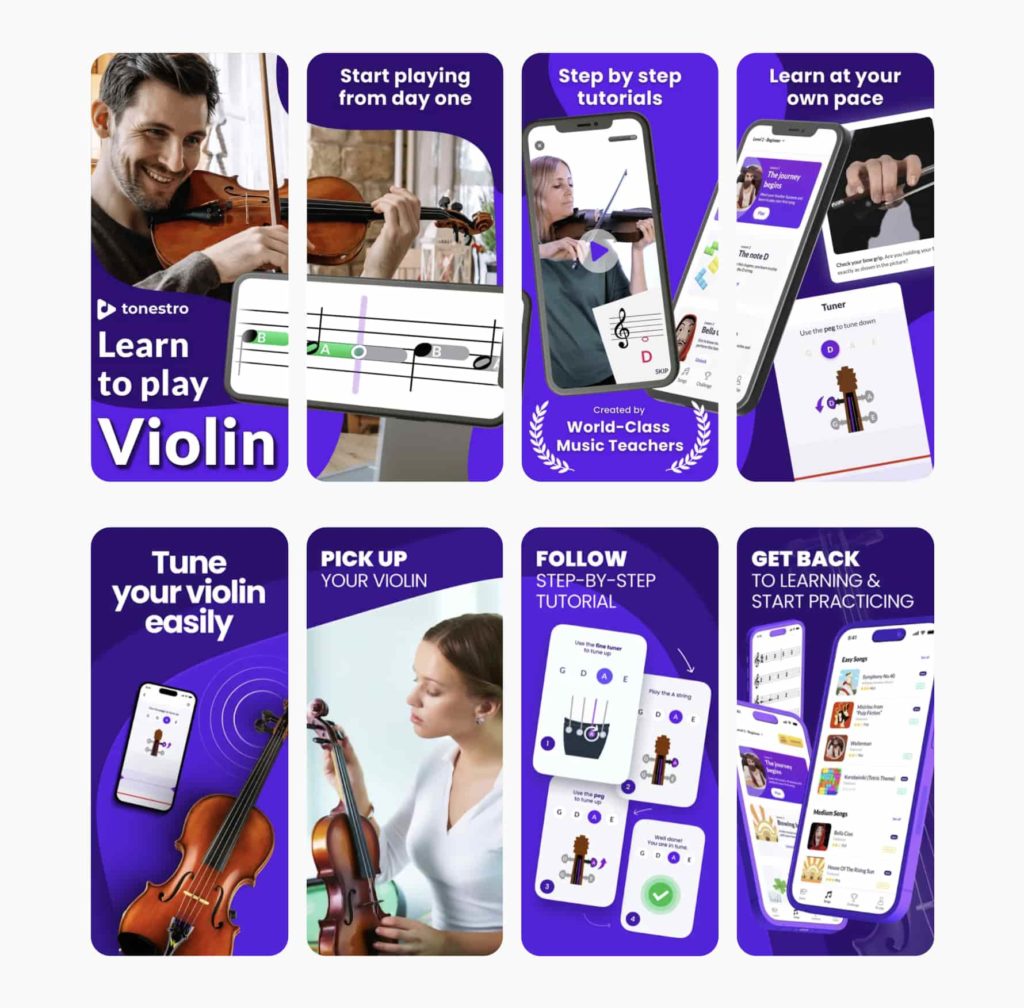
However, these page elements can (and should) differ from those within the app’s default page. Thus, In principle, they’re meant to provide a unique experience to a person discovering the app through various advertising channels or keywords. Following the most recent WWDC25, custom product pages are now available for organic keywords on the App Store, in addition to Apple Ads. This is a significant change, as previously they could only be accessed through paid campaigns or direct external links.
This update adds yet another layer of personalization, following deep links that allow you to create a seamless user journey from the ad to a specific piece of in-app content, not just to the app’s generic home screen. To learn more about custom product pages and how you can leverage them, make sure to read our article:

Apple Ads targeting options include the following parameters:
How these are handled depends mainly on the chosen account structure, app functionality, business goals, and budget. Remember that according to recommendations for audience settings of Apple Ads, in the first quarter of 2022, 78% of App Store iOS 15 search volume came from devices with Personalized Ads turned off. In most cases, it’s recommended to target all ages, genders, and locations and include device type, customer type, and schedule when the app’s functionality validates it.

Apple Ads provides three dashboards or reports: the Campaigns dashboard, the Charts dashboard, and Custom Reports.
In essence, Apple Ads conversion tracking allows advertisers to view and process all the data needed to evaluate campaign performance, starting with impressions and all the way down the funnel to downloads.
Apple Ads is also equipped with the Attribution API, which our platform uses. Thus, SplitMetrics Acquire Starter Plan provides a full-funnel view of a user’s journey. One key reason advertisers use our platform is that it extends Apple Ads reporting.
The scope of optimization provides a clear picture of the workflow and workload associated with day-to-day Apple Ads management, which includes weekly health checks, bid adjustments, keyword adjustments, and other tasks.

SplitMetrics Acquire, including its free Starter Plan, provides an immense variety of automation rules that can improve your Apple Ads experience, reduce workload, optimize performance, and ultimately make your decisions even more data-driven.
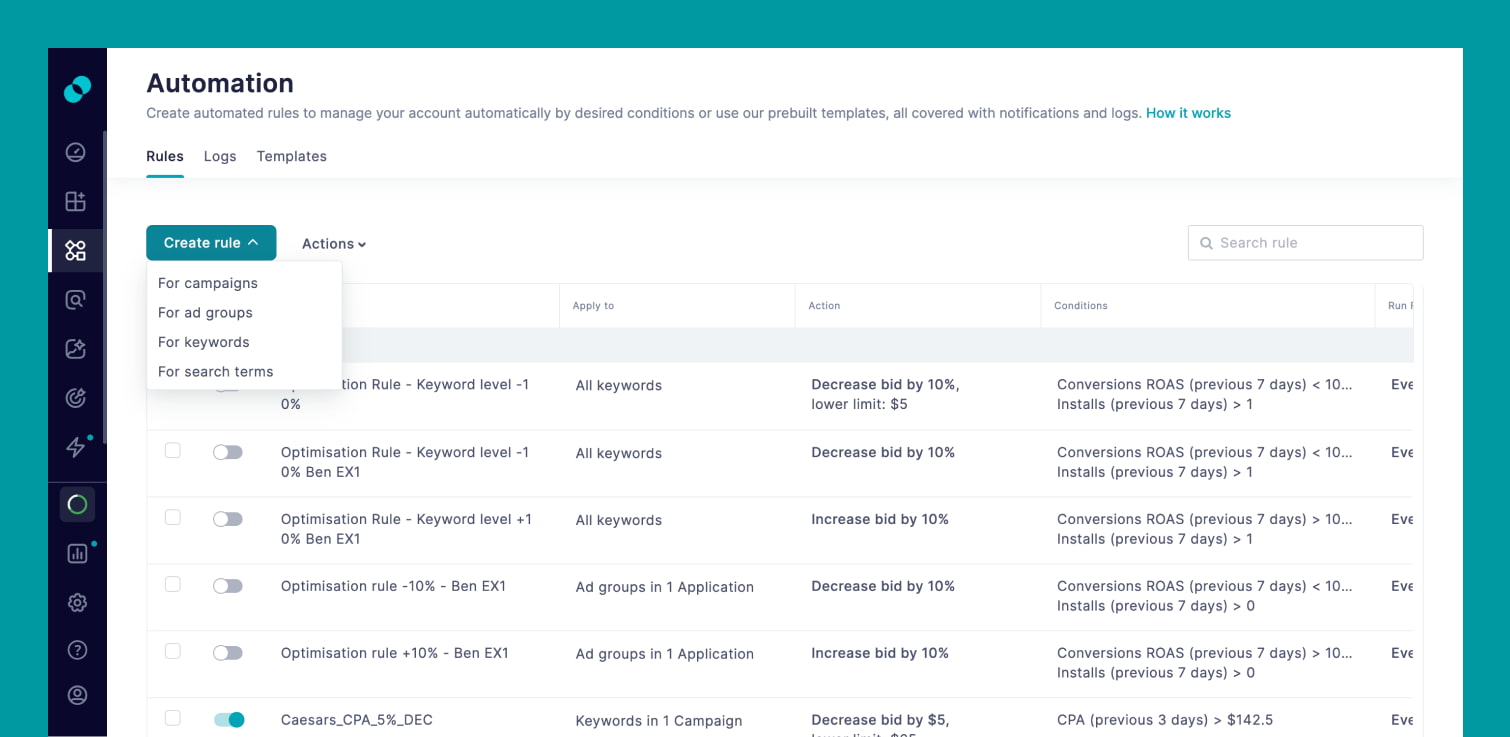
What our system can do covers all the optimization and management aspects covered in this article. From bid optimization to running discovery campaigns and keyword rotation in your account structure.

Aligning App Store Optimization (ASO) and Apple Ads strategies can significantly improve the visibility and performance of mobile apps on the App Store. Let’s explore how ASO and Apple Ads should connect for the best results.
App Store Optimization (ASO) is the foundation of every successful Apple Ads campaign, as one of its pillars is conversion rate optimization. ASO is concerned with making available imagery that is as appealing to the user as possible. It includes designing and optimizing the icons, screenshots, preview images, videos, etc.
Additionally, a strategic approach to the app’s product page metadata can send the proper signal to the App Store’s search algorithm, potentially impacting the effectiveness of discovery campaigns or product page ads (shown on pages of relevant apps, most similar to yours).
Apple Ads can be a powerful tool to help inform your ASO strategy. Its metrics can help you identify the best keywords. Custom product pages can be a key inspiration for optimizing the default product page. Importantly, by capturing high-LTV and engaged users and directing them to an app’s page, an Apple Ads campaign can help boost your visibility on the App Store. This combined with a well thought through organic strategy is the secret to success – as everything starts with a well optimized App Store Product Page.
We see these results from our clients when they start streamlining their Apple Ads and ASO efforts and have them work together. Check out these brilliant success stories of Locals and Livintis to learn more about the synergy of Apple Ads and ASO!

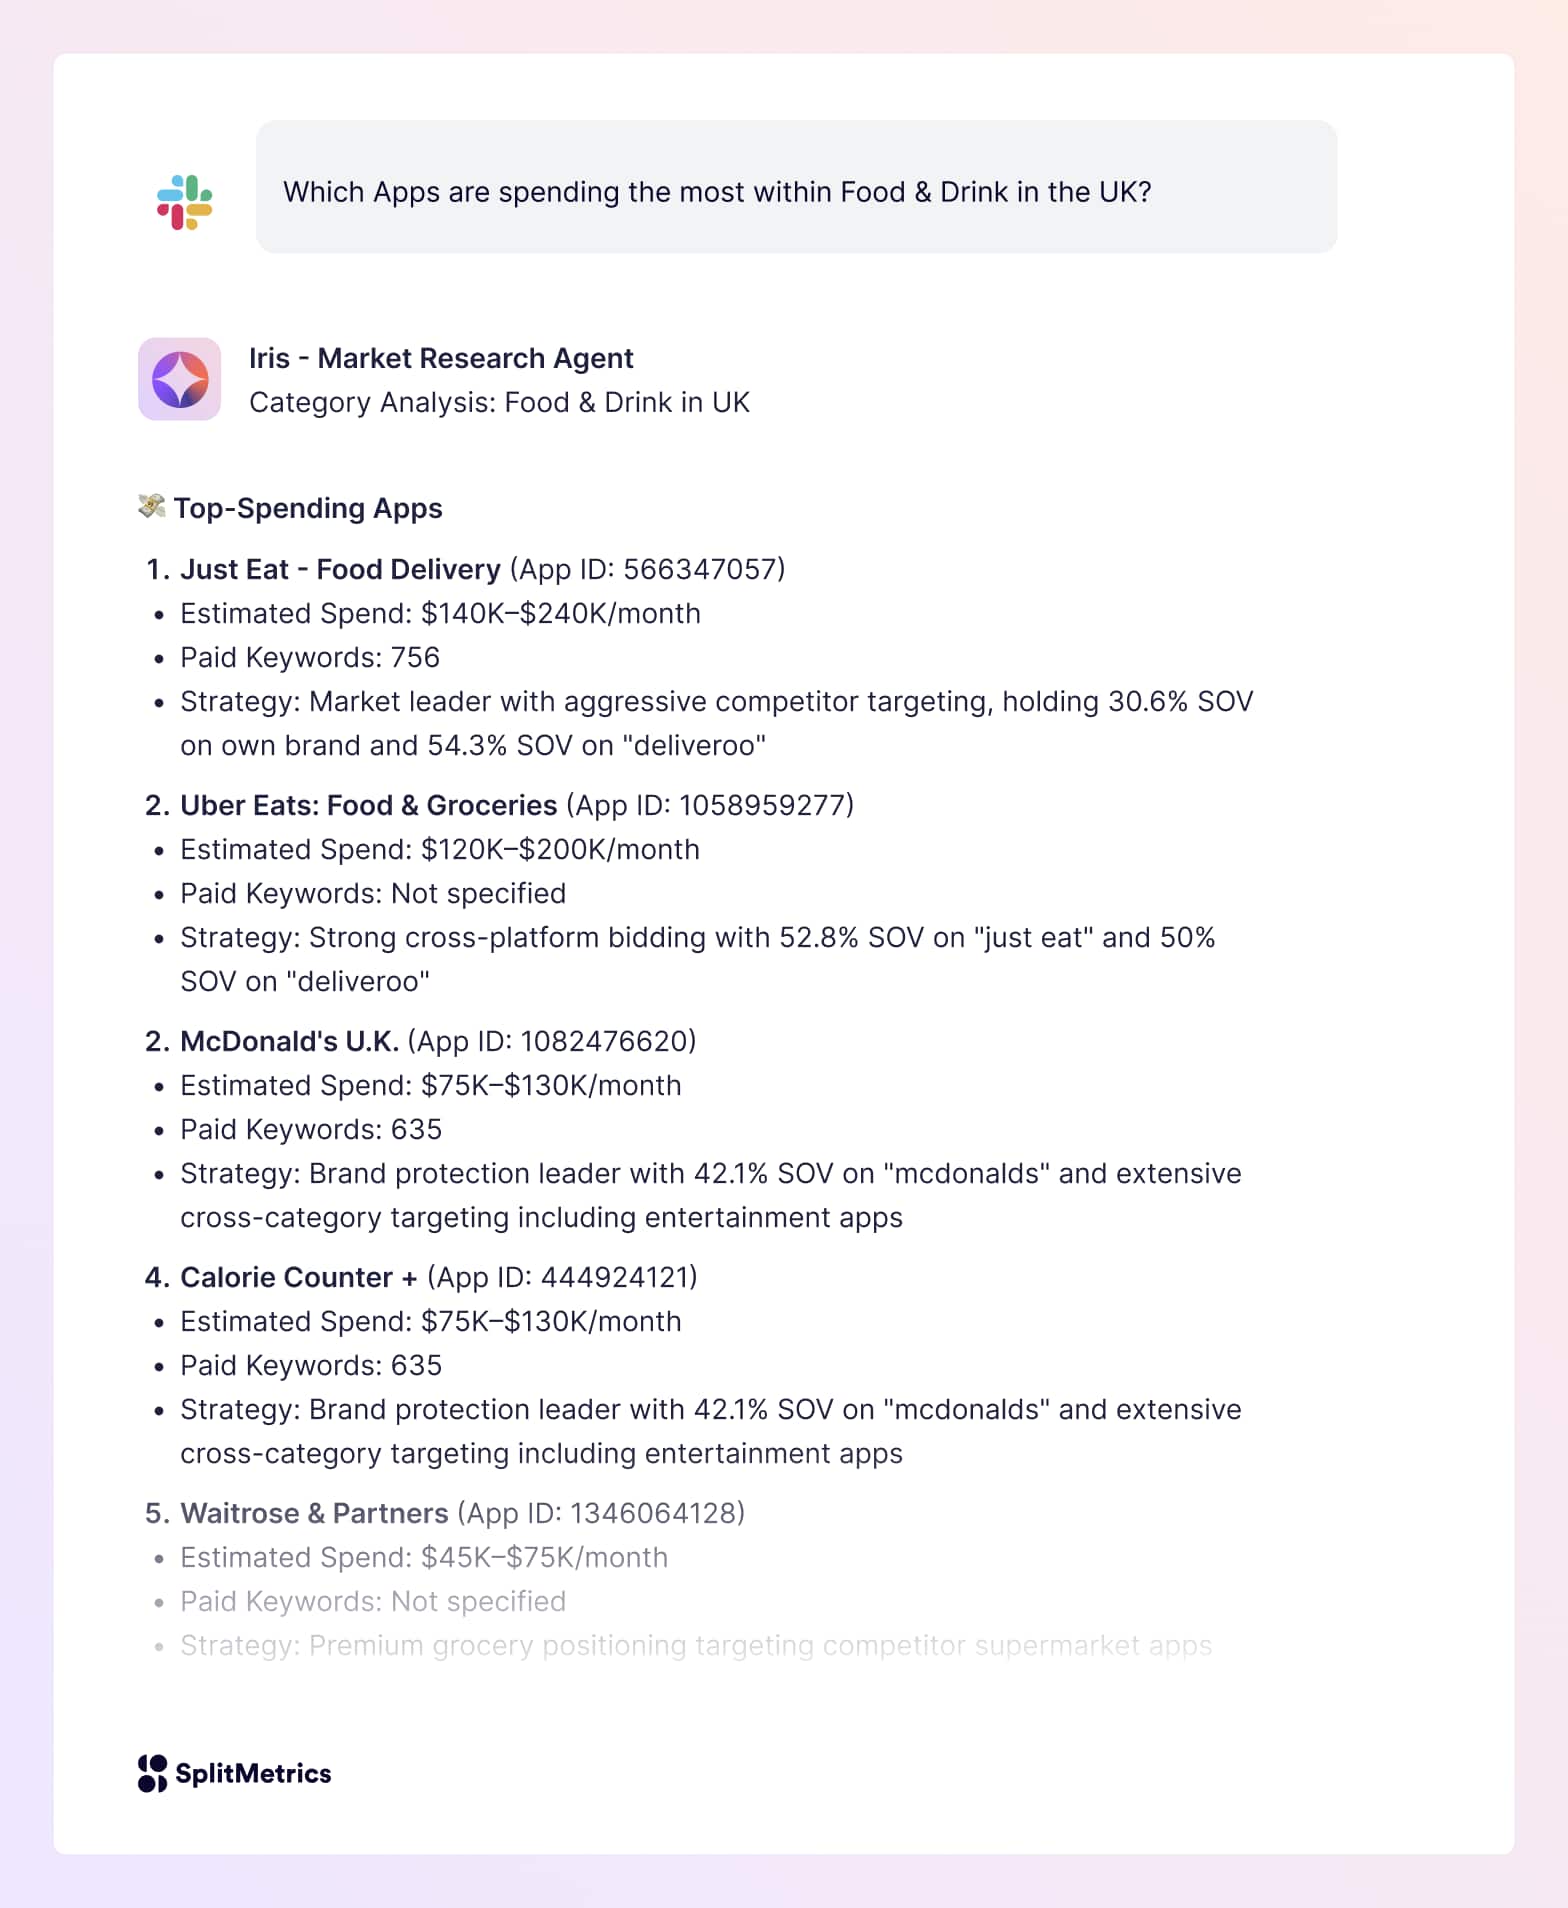
Iris is the first AI agent purpose-built for Apple Ads, built & trained by SplitMetrics’ team of experts in mobile marketing, to drive app growth. It can make your journey with Apple Ads even easier, because just like ChatGPT, it provides instant answers backed by highly specific, app market intelligence data.
We’ve reviewed and aced the basics; now it’s time to learn about 11 Apple Ads best practices that will help your app triumph on the App Store.
SplitMetrics’ 11 Best Apple Ads Practices:
1. Measure Post-Install Performance
2. Create the Right Account Structure for Search Results Campaigns
3. Think Carefully of Your Campaigns and Ad Groups
4. Never Give Up on Keyword Research
5. Research Your Competitors
6. Don’t Rely Solely on Search Match
7. Put Negative Keywords to Good Use
8. Optimize Apple Ads
9. Pick App’s Metadata With Care
10. Unite Your ASO and Apple Ads Efforts
11. Make Use of Custom Product Pages
Learn more about these in the article below.
In the ever-changing world, steady app market growth seems to remain one of a few constants and it’s especially true for the App Store.
Being the only ad platform that allows you to advertise apps within the App Store itself, Apple Ads offers app marketers an opportunity that should not be ignored. It’s all about discoverability and improving your overall performance. Some advertisers even notice higher app store rankings associated with the success of their campaigns.
Once you have a clear understanding of your app’s value and your audience, you’ll be able to launch thoughtful and meaningful campaigns.
SplitMetrics Acquire, an Apple Ads partner, can help you streamline your efforts to get the most out of this user acquisition channel. This Apple Ads management platform provides AI algorithms and competitor insights backed up by a dedicated team of professionals. Maximize Apple Ads ROAS and minimize workload with smart automation rules!