Apple Ads — 20 Dec 2024
Apple Ads Metrics: How to Evaluate Your Campaigns?
 Gabriel Kuriata
Apple Ads metrics include impressions, downloads, taps, tap-through rate (TTR), conversion rate (CR), cost-per-tap (CPT), cost-per-acquisition (CPA), and multiple more for precise performance evaluation.
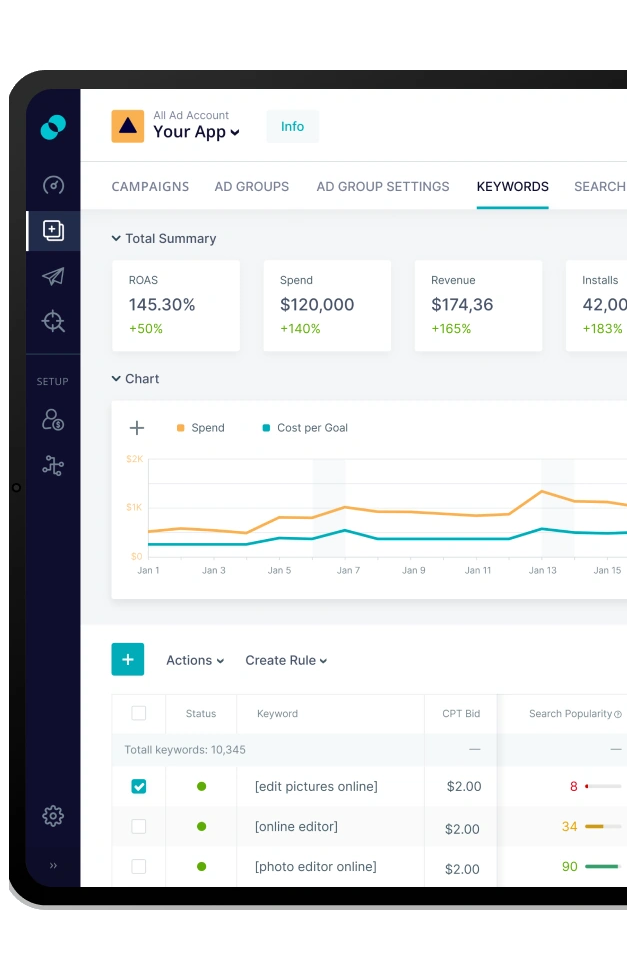
Advertisers who manage their campaigns through platforms such as the free SplitMetrics Acquire Starter Plan and connect their accounts to a mobile measure partner (MMP) gain access to additional post-install metrics, effectively having a full-funnel overview of users’ journeys.
Apple Ads includes by default the following metrics: Average CPA, Average CPM, Average CPT, Average Daily Spend, CR, Dimensions, Impression Share, Impressions, Installs, Match Source, New Downloads, Rank, Redownloads, Search Popularity, Search Term, Spend, Taps, TTR.
Accurate evaluation of Apple Ads campaigns requires understanding all the key metrics and their value in the context of our app, its competitors, and the App Store in general.
This is especially important to beginners, as only a proper measurement plan and full-funnel analytics will reveal the immense value Apple Ads provide.
This article will:
– Explain the key Apple Ads campaign metrics: how to calculate them and optimize campaigns for them;
– Give insights into other Apple Ads metrics, like CR, TTR, impression share, download velocity, etc.
– Show why integrating with a mobile measurement partner (MMP) is crucial to success with Apple Ads.

Apple Ads is an advertising channel that helps people discover your app on the App Store, the place to reach iOS users. They tend to be affluent, as the App Store continues to generate twice the app revenue than Google Play every year, despite hosting a third of its apps, according to figures released by Statista. This has several implications:
App Store users have a higher lifetime value on average than Google Play users. This means that throughout their experience with a mobile app or game, they’ll be more likely to subscribe to premium plans, make more purchases, or perform other revenue-generating activities. This is visible when comparing the performance of the same app on both marketplaces.
Analyzing apps from various categories, we found that the same app can have retention rates significantly and consistently higher on iOS than on Android. Differences measured after 1 day, 7 days, two weeks, and a month show a 9-15% advantage, highlighting how engaged users acquired on the App Store are. This also translated into LTV disparity.
| LTV | 0D | 1D | 7D | 14D | 30D | 45D | 60D |
| iOS | $0.3937 | $0.4447 | $0.6065 | $1.24 | $2.23 | $2.68 | $3.17 |
| Android | $0.0086 | $0.0093 | $0.0112 | $0.0129 | $0.0129 | $0.0142 | $0.0162 |
A user’s lifetime value (LTV) for the same app can be significantly higher for iOS users than for Android users. The sample above shows a distribution for the same app, which is present on the App Store and Google Play.
Apple Ads exclusively enables you to reach that audience with four ad placements strategically throughout the App Store: on the Today tab, Search tab ad, in search results, and on app product pages. The advertising platform reaches a highly engaged audience, which translates directly to its average values of conversion rate and tap-through rate.
Apple Ads campaigns help you reach high-value and high-intent users of the App Store, resulting in retention rates of up to 30% (based on our internal data from a promoted app) after one month, double what a social media campaign could accomplish. We observed the same trend for LTV.
The average value of cost per acquisition or cost per tap is heavily category-dependent, as each includes apps with unique audiences and various business models. However, there’s always a correlation between CPT or CPA and return on investment (ROI).
This is the true value of Apple Ads as a user acquisition channel for the App Store: its attainable ROI, generated by users with high LTV average revenue per user (ARPU).
Access full-funnel mobile marketing metrics through the free SplitMetrics Acquire Starter Plan connected to a mobile measurement partner (MMP) to optimize your campaigns to acquire high-LTV users of the App Store.
Consequently, the most important metrics to understand one’s position on a path to success (profits) are post-install metrics used to evaluate ROI. These are available via Apple Ads Attribution API, or if you prefer not to integrate directly, you can use platforms like the free SplitMetrics Acquire Starter Plan.
These are crucial because they connect user acquisition with their value. You’ll most likely optimize your bidding strategy for them and impression share.
Impression share informs you about the percentage of views your app received among all generated. Note that Apple reports impression share in 10% buckets – see how proprietary share of voice measurement compares.
All metrics are relevant because they allow analysis of user behavior in all funnel stages. In practice, the following are crucial to understanding your performance:
Other metrics provide a more granular explanation of performance. Here, we’d like to focus on two and advise each advertiser to keep a close eye on them:
Only full-funnel Apple Ads metrics will enable you to see the complete picture of your campaign performance and understand the actual value of this user acquisition channel.
Integrating a mobile measurement partner (MMP) or implementing the Apple Ads Attribution API is necessary to connect Apple Ads metrics describing campaign performance with in-app events like purchases or subscriptions. Apple Ads can be managed through an external service, like the free SplitMetrics Acquire Starter Plan, to help bridge campaign data and post-install events.
Such an integration requires no coding and is performed with a few clicks to connect all the accounts, although some delay in displaying relevant data might occur. The free SplitMetrics Acquire Starter Plan can be connected with the systems of various mobile measurement partners, most of which offer a free plan for their users.
Knowing how to calculate key target metrics is helpful in fully understanding their value for campaign evaluation and proper optimization.
Goals are custom post-install conversions specific to each app and dependent on its mobile app monetization strategy. They can include submitting for a trial, an in-app purchase, a full subscription, some form of engagement, or reaching a specific event in a mobile game.
While setting up your free SplitMetrics Acquire Starter Plan account, you’ll be prompted to define your app’s valuable events. Custom conversions (goals) don’t have to drive cash flow directly, but they always have value attributed to them because they ultimately lead to revenue.
Someone who passes a particular stage is more likely to make more purchases or view reward ads in the future, for example. Therefore, reaching that stage has a specific value that can be configured as a custom conversion.
The cost per goal (CPG) encapsulates the cost of acquiring a user who has performed a specific action after the installation. The target CPG is the cost you’re prepared to pay, while the average CPG is the money you’re spending. If you want your campaigns to be profitable, the target CPG must be lower than the revenue generated from the action.
Average CPG is calculated by dividing the overall spend by the number of target user actions.
Average CPG = Spend / Goals
Let’s say you’ve spent $100 on an ad, which resulted in 10 in-app purchases. $100 / 10 = $10. This is the average amount you pay for a target action.
Target CPG is decided on a user’s lifetime value (LTV)
Let’s return to the example of the subscription-based fitness app. Subscription is a target action in this case. Let’s assume that we know the average LTV of our paying users and that it remains constant. Suppose an average user pays $40 annually and uses the app for 2 years. In other words, the average revenue per user (ARPU) is $40, and lifetime (LT) lasts 2 years. In this case:
LTV = LT x ARPU = 2 x $40 = $80
In this case, the cost of a target action should not exceed LTV = $80. LTV is gross profit; other expenses, such as fees, taxes, support, etc., are also relevant to our calculations. For simplicity, let’s assume that these consume 50% of our revenue:
Profit = LTV x 50% = $40
Consequently, $40 is the cost per goal (CPG) we, as advertisers, should treat as our break-even point. However, we need to set a line somewhere to speak of actual profits:
Target CPG = 75% x Profit = 75% x $40 = $30
We’ve reached a target CPG of $30, with an assumed 25% profit margin. The example used very simplified figures to streamline calculations. Still, we hope it highlights the core consideration of all new to Apple Ads: you must understand your average user’s journey well to set your goals.
The table below shows a summary of setting goals:
| LTV | $80 | ARPU x LT |
| LTV- fees, support, etc. | $40 | Fixed costs for subscription services |
| Break-even CPG | $40 | If we use this CPG, we will get the same amount that we pay |
| 75% x CPG(25% profit margin) | $30 | If we use this CPG, we will get a profit of $10 from every paying user during their LT |
Cost-per-goal optimization strives to acquire the most users possible without spending over our target CPG for each one. Knowing our target CPG, we can adjust the max CPT bid accordingly.
Attention to post-install conversion rates, such as install-to-purchase or subscription-to-conversion, is vital for CPG optimization. It’s essential to detect potential issues with the in-app onboarding and draw sensible conclusions from them.
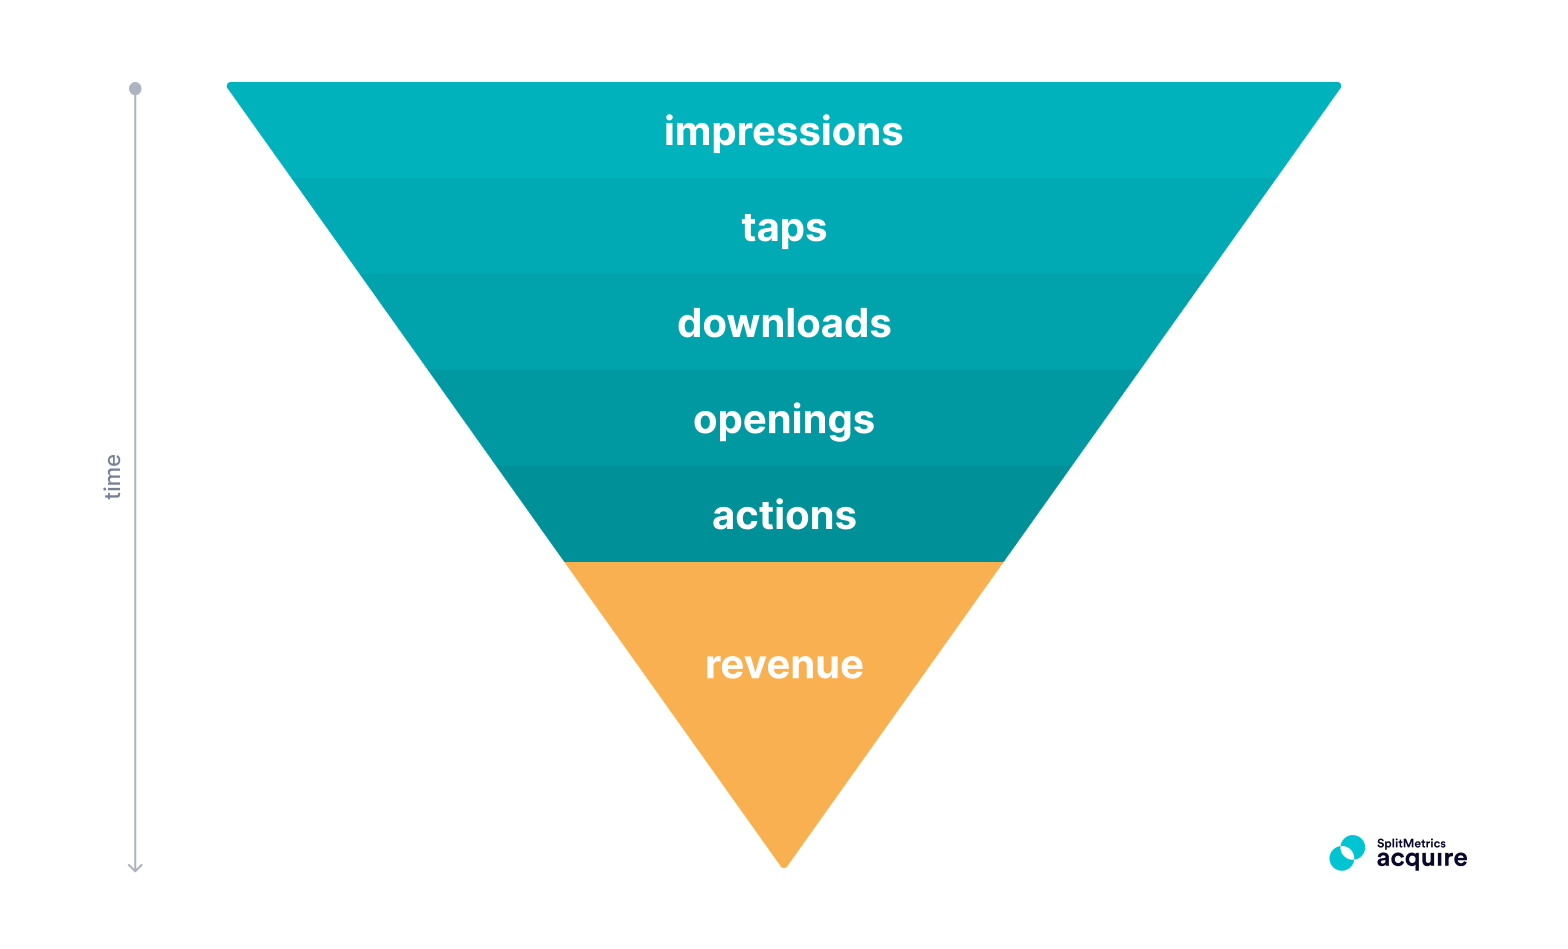
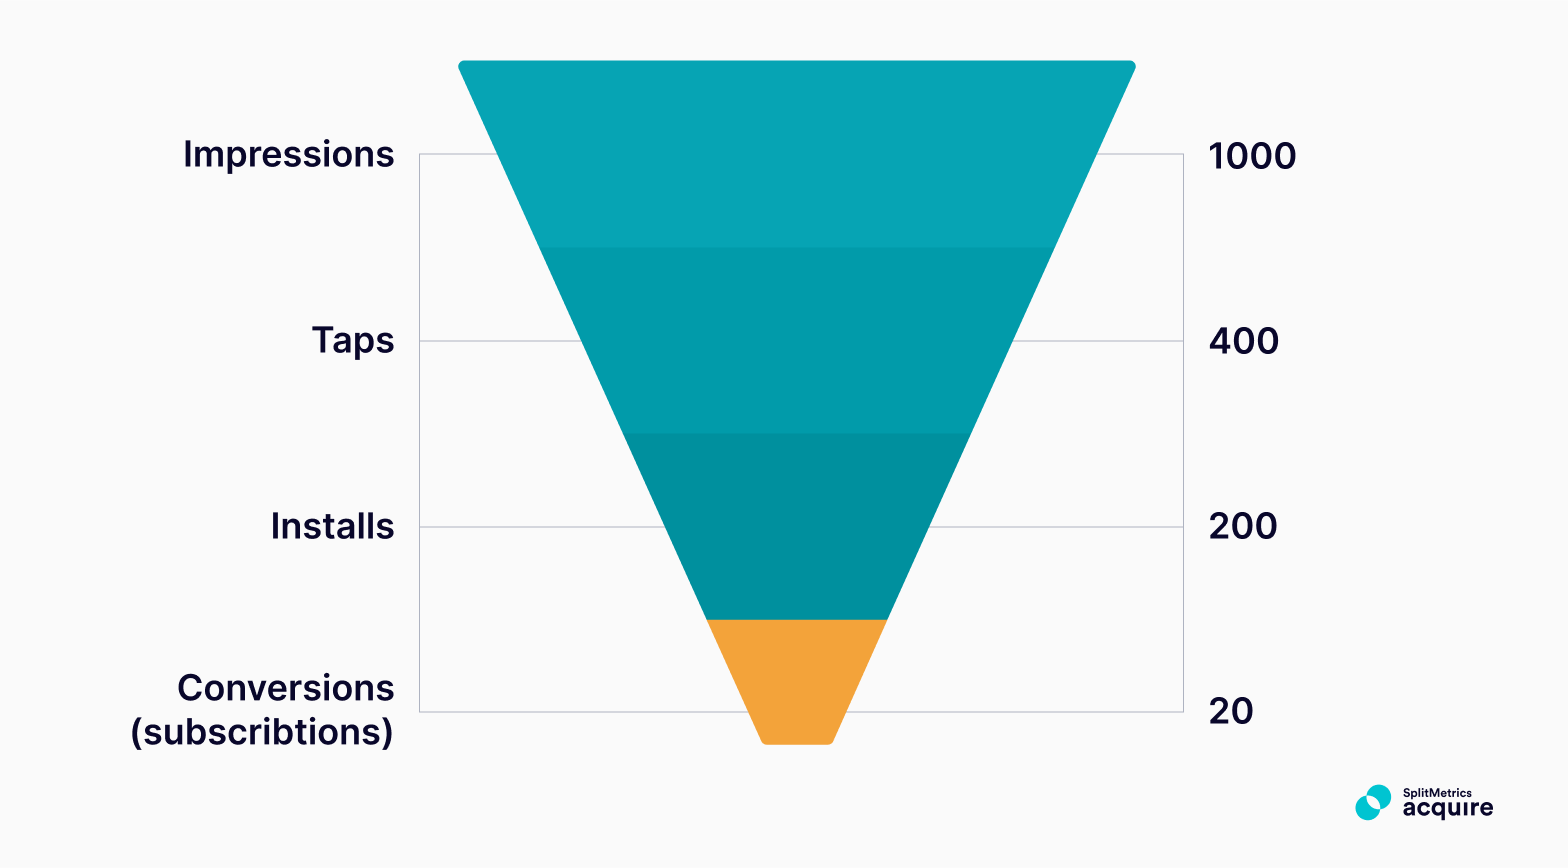
Even assuming moderate benchmarks show potential consideration. Look at the funnel below, with a 40% tap-through rate (from 1000 impressions, we get 400 taps) and a 50% download rate/conversion rate (200 downloads from 400 taps). Finally, our custom conversion rate is 5% (20 subscriptions that followed 200 downloads).
Try targeting a goal higher in the funnel to have a more considerable volume of revenue goals for weighted decisions. For example, if you only have 1-2 monthly purchases per keyword, pick up an additional metric like trials/registrations.
In Apple Ads, acquisition is equated with a download, and the cost per acquisition (CPA) is the cost of generating it.
Average CPA = Spend / Downloads
Establishing your target CPA follows a logic similar to what we used for CPG. You must make certain assumptions about post-install conversion rates and the value you expect users to deliver. Understanding identical metrics and user journeys is also necessary to set a sensible target for your campaigns. In other words, calculate the target CPA like you’d have CPG. To calculate your target CPA, follow the above procedure, exchanging CPG for CPA.
However, relying on a CPA without proper integration with a mobile measurement partner will impact your Apple Ads optimization and management severely:
Higher workload: With MMP integration and automation, Apple Ads is an accessible, streamlined, and efficient platform for running ads. Remember, many mobile measurement partners offer free plans that can be successfully used with the free SplitMetrics Acquire Starter Plan. Integrations require no coding. By connecting Apple Ads campaign data with figures from an MMP, you can optimize your bids, considering actual events rather than assumptions or manual calculations.

Return on ad spend (ROAS) is a metric used to assess profitability when in-app events generate revenue of varying value. Post-install events are not limited to subscriptions only. There are in-app purchases where users pay variable prices. For example, a single purchase of virtual currency in a mobile game can contribute anywhere from $1 to $1,000.
Return on Ad Spend (ROAS) measures the revenue generated for every dollar spent on advertising, calculated as total revenue divided by ad spend:
ROAS = Revenue / Ad Spend x 100%
For example, you allocate $100 for advertising, which brings you $120 in revenue. In this case:
ROAS = Revenue / Ad Spend x 100% = $120 / $100 x 100% = 120% (1.2x)
Revenue from ad campaigns should always exceed advertising costs.
The idea behind ROAS optimization is to keep returns at a particular level. Again, let’s use the example of a mobile game with in-app purchase options ranging from $1 to $1,000.
Similar to CPG optimization, we can assume a 50% break-even point, considering fees, support, and other expenses. Let’s calculate the maximum ad cost of sales (ACos) for revenue of $1,000:
| Revenue | $1,000 | |
| 50% – fees, support | $500 | Acquisition and support costs needed to raise the revenue |
| Break-even Ad Spend | $500 | |
| Maximum ACoS | 50% | ACoS stands for Ad Cost of Sales. As long as you don’t spend more than 50% of the revenue ($500) on ads, you’ll break even. |
| Minimum ROAS | 2.0x (200%) | ROAS = 1 / ACoS = (1 / 0.5 = 2.0x)Return on Ad Spend is 200% |
| Target ROAS | 2.5x (250%) | If you want to make a profit, maintain a return greater than Min ROAS; in other words, reinvest a smaller portion of revenue into ads.Target ACoS = 1 / 2.5 = 40% (not 50%) |
Some businesses want to hit a target ROAS of 2.5x, others – 4x. It’s up to you to decide on the portion of Profit per Sale you want to spend on ads. You can apply this calculation to each keyword based on its specific funnel.
While applying this calculation to each keyword based on its specific funnel is helpful, it’s important to consider that not all keywords serve the same purpose. Some keywords, even with a lower ROAS, can play a critical role in building brand recognition. For example, when launching a new app in the travel category, targeting keywords like “specific country + hotel” might not yield immediate ROAS but is essential for establishing brand presence. If the same strategy or calculation is applied uniformly across all keywords without considering these nuances, there’s a risk of missing the bigger picture and overlooking valuable branding opportunities.

Cost per tap (CPT) is an underpinning pricing model of Apple Ads. In Apple Ads, you pay only when users tap on your banner, and CPT shows how much this tap costs you. For example, after spending $1,000 on advertising and receiving 500 taps, your CPT will be:
СPT = Ad Spend / Taps = $1,000 / 500 = $2
Average CPT helps to trace the overall health of your marketing campaign. It’s a metric you need to factor into your CPG, CPA, or ROAS projections. Our campaign data point to significant differences in average CPT in Apple Ads between categories on the App Store:
High CPT translates to a high average CPA, CPG, and lower ROAS, so let’s examine how we can optimize this parameter.
To find the most optimal cost per tap:
Tap-through rate is the percentage of users who tap on your ad after seeing it either in search results, on the Today tab, on the Search tab, or while scrolling through a competitor’s product page.
Tap-through rate = Taps / Impressions x 100%
A high tap-through rate is crucial in maintaining an optimal cost per tap (CPT).
Conversion rate (CR) in Apple Ads refers to the percentage of users who download your app after landing on its product page on the App Store. It’s the primary metric to establish your funnel’s health. Here’s the formula to calculate CR:
Conversion Rate = Downloads / Taps x 100%
High conversion rates translate directly to lower average CPA, CPG, and increased ROAS.
TTR and CR are crucial in shaping your CPT, CPA, CPG, and ROAS. Both require creative optimization to address user intent best and establish a connection between an app and its audience.
TTR and CR optimization go beyond the confines of Apple Ads, Requiring both strong ASO and utilizing the platform’s creative tools. What can you do to improve these metrics?
Refer to benchmarks to decide whether/how much optimization your TTR and CR need.
Tap-through rates vary by category, just like conversion rates.
Studying benchmarks is especially important for TTR and CR because various factors impact these Apple Ads metrics on a category level. For example:
Refer to SplitMetrics’ Apple Ads benchmarks dashboard for daily work. We also release benchmark reports regularly to give you a deeper, better understanding of the inner workings of each app category on the App Store and foreign markets.
Download velocity relates to the number of downloads generated within a specified time. Downloads describe the overall number of installs a campaign, ad group, or keywords has generated. Both metrics are significant for understanding the app’s performance on the App Store.
Success in Apple Ads involves remaining profitable while operating at a scale that positively impacts an app’s overall ROI.
High download velocity frequently signifies a new app rapidly gaining popularity. It impacts organic rankings and is undeniable proof of the app’s relevancy, just like many downloads signify an established app worth recommending. Dynamic app growth will result in more app growth.
How do you achieve optimal download velocity and a high number of downloads?
Impression share informs you about the percentage of views your app received among all generated views. An impression share above 95% for a specific, exact-match keyword means that users using it will see your ads almost exclusively. Impression share is a vital metric for brand campaigns.
The formula for an impression share is straightforward:
Impression share: (our app’s impressions / all impressions for a target keyword)*100%
Brand campaigns are frequently optimized to maximize impression share for them, with the goal of user acquisition and brand protection. Exclusivity for these strategic keywords means we acquire all the valuable traffic of high-intent users and ensure that competitors don’t divert it to their apps simultaneously. An impression share of over 90% is advised.
Increasing impressions is vital for new keywords with no historical data and is a proxy campaign goal (also referred to as proxy or testing). It aims to accumulate performance data quickly so that a keyword can be assigned to a proper exact-match campaign for optimal bidding.

SplitMetrics Acquire bridges Apple Ads and mobile measurement partners (MMP), connecting campaign data with in-app, post-install metrics in one place. Here are the key benefits of managing Apple Ads through our platform and connecting it with an MMP:
The free SplitMetrics Acquire Starter Plan makes monitoring and analyzing all Apple Ads metrics easier. Optimization and management can be highly automated, reducing errors and constantly reacting to running campaigns’ ever-changing dynamics.
Sign up for the free SplitMetrics Acquire Starter Plan to see more metrics that will give you an even better understanding of your Apple Ads campaign performance. Focusing on the right metrics in the funnel is the key to unlocking the great value of this user acquisition channel.