Apple Ads Benchmarks H1 2021
 Lina Danilchik
According to Statista, the App Store is the second-largest app store in the world with about 2.22 million apps and games available as of July 2021. At the same time, the number of apps on the App Store has been steadily growing over the years, while app discoverability continues to be one of the biggest challenges for mobile marketers.
Apple Ads is a platform designed to address this challenge and help publishers reach out to their target users instantly.
We’ve carried out research and analyzed how Apple Ads performed in the first half of 2021 across various categories and regions. The collected data was introduced in the benchmarks report, where you may compare your performance against the industry benchmarks, identify opportunities for improvement and help users discover your apps.
Apple Ads Benchmarks Report Q1-Q2 2021 provides:
The report is based on the aggregate data from apps that optimize Apple Ads campaigns using Splitmetrics Acquire.

The period under review: January – June 2021 (H1 2021).
Sampling
1. Excluded categories: News, Weather, Reference, Medical, Music and Navigation.
To provide consistent and reliable data, we left out categories with fewer than 5 apps, which could produce statistically insignificant results in aggregate.
2. Excluded developers: we left out those SearchAdsHQ clients whose policy states that their user data shall not be used in our reports, including the anonymous aggregate form.
Methodology
The report draws on internal data and industry insights to help mobile developers and marketers better understand current trends in their niche. The methodology is based on dividing specific quantitative data, such as spend, taps, impressions, downloads and installs, by a specific total, depending on the required indicator in accordance with the necessary type of information display: App Store category or Apple Ads region.
We used the following formulas to calculate each of the key indicators:
CVR = downloads / taps
TTR = taps / impressions
CPM = (spend * 1000) / impressions
CPT = spend / taps
CPA = spend / downloads
In this report edition, you’ll find the average TTRs and CRs, as well as CPTs and CPAs by categories and countries for H1 2021. We also compared them with Apple Ads benchmarks of the previous years, quarter-over-quarter.
In 2021 the rules of the game keep changing, and this is what the whole mobile app industry is about. But one thing remains constant: Apple Ads is still one of the most effective ad platforms that help developers and marketers address users at the right time – anticipating their intent.
Our mission is to help publishers optimize Apple Ads campaigns and make the most of this ad channel, that’s why we clearly understand the importance of benchmarks for the community.
SplitMetrics’ ASA benchmarks give a fantastic perspective on trends on the App Store in general, and Apple’s unique ad product in particular. In this latest edition, some significant shifts are highlighted for 2021.
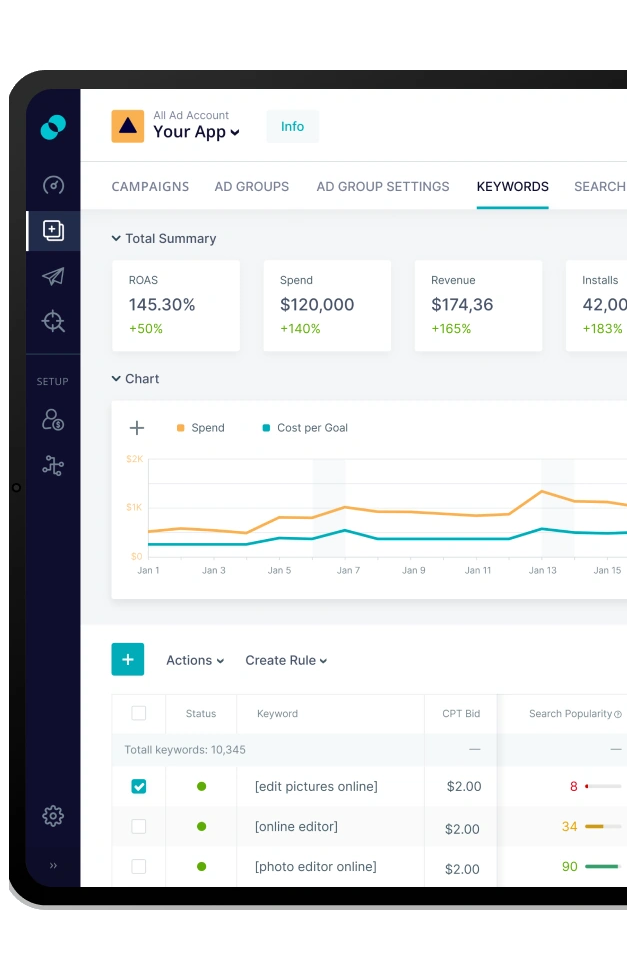
Stay on top of the latest trends, optimize and scale your Apple Ads campaigns with benchmark data on CPT, CPA, CPM, TTR, and CVR. Leverage SplitMetrics’ Apple Ads Benchmark Dashboard to assess your search results and Search tab campaign performance, find opportunities and win the competition.