Overview Dashboard: Keep App Performance Under Control
 Lesia Polivod
Lesia Polivod
Lesia Polivod 
Digest your Apple Ads campaigns performance in minutes!
With SplitMetrics Acquire Overview Dashboard, you can monitor consolidated Apple Ads full-funnel data in one place and digest it in a flash for proactive optimization.
Monitor key performance indicators, including post-install metrics, on one page:
Overview Dashboard is your app performance radar that helps make strategic decisions in minutes.
Get a helicopter view of the app’s performance by highlighting trends and dramatic changes. Spot new growth opportunities, and make data-driven strategic decisions.
“We are surrounded by data, but starved for insights”
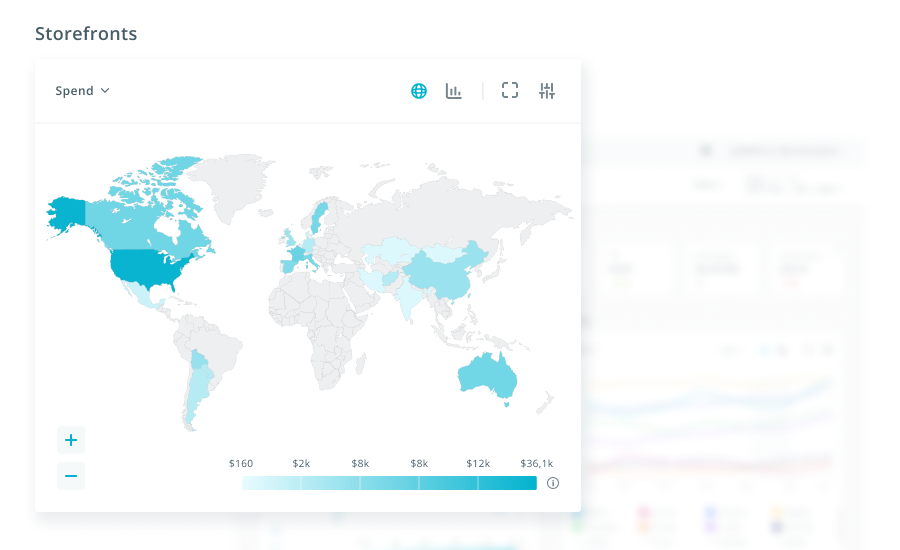
The Storefront widget can track metrics dynamics in absolute values on a gradient map or histogram. You can monitor app spending, in-app or custom conversion, cohort, or custom metrics to illuminate the most important changes in each Storefront for single geo- campaigns for a selected date range.
With this widget, you can monitor changes in app reach by choosing impressions, taps, or spending. Or you can monitor storefronts’ performance dynamics by choosing post-install data or cohort metrics for drill-through analysis.
Explore the whole picture and your position dynamics worldwide on a gradient map. Compare selected metrics by region to detect how performance changes in each Storefront.
With the Trends widget, you can compare metrics in absolute values for up to eight storefronts: evaluate the number of installs and downloads, trials or subscriptions, or spend to analyze your geolocations’ performance. Take data-driven data actions for future app growth in minutes.
Digest your performance results and monitor trends with the new insightful Overview Dashboard.
Get a deeper understanding of your crucial metrics with data drill down from campaigns and ad groups to keywords and ad variations using custom product pages. Set a primary metric to analyze the top highest and lowest performance indicators, compare it with two other metrics in one chart for one or many geolocations, and compare dynamics from the previous period.
With the new Dashboard Overview, you can have a high-level summary of top spenders or storefronts to faster monitor changes and their impact.
Monitor all the dramatic changes in Storefront over the custom period at any level in one chart. Find the anomalies and improve your strategy.
React to dynamics of growth and decline in your Storefronts with the Biggest changes widget.
Get a helicopter view of the app performance for faster data-driven decisions on scaling.