Bid History on Graphs: Data-Driven Decisions in SearchAdsHQ
 Lina Danilchik
Lina Danilchik
Lina Danilchik 
SearchAdsHQ rolls out a new feature to make it possible for users to track keyword bid history over time.
Changing bids is one of the main ways to scale Apple Ads campaigns: it leads to changes in metrics. As a rule, the higher the bid, the more impressions you get but sometimes a bid increase results in a huge amount of impressions & downloads, and sometimes you just watch an increase in spend.
To make sure that a particular bid change is responsible for changes in CPA, ROAS, Spend and other critical metrics, and decide what to do with bids right now, you need detailed information on bid changes and metrics values on specific dates.
Some publishers work with a certain share, let’s say, 20% of keywords that generate 80% of profits, and change keyword bids rather often. To figure out the causes of changes in Apple Ads campaigns performance, they used to dedicate hours of routine manual work with third-party tools (like Google Sheets) to record each change to bids.
To help our clients save time, focus on what matters most and enhance their user experience, we have introduced a feature enabling SearchAdsHQ users to track historical data on bids with the help of graphs.
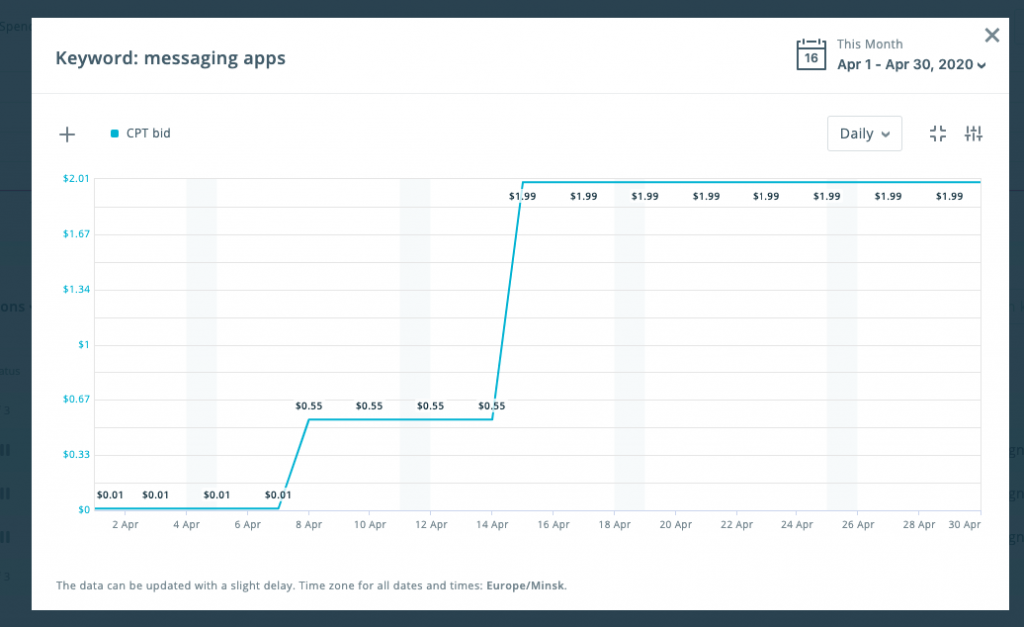
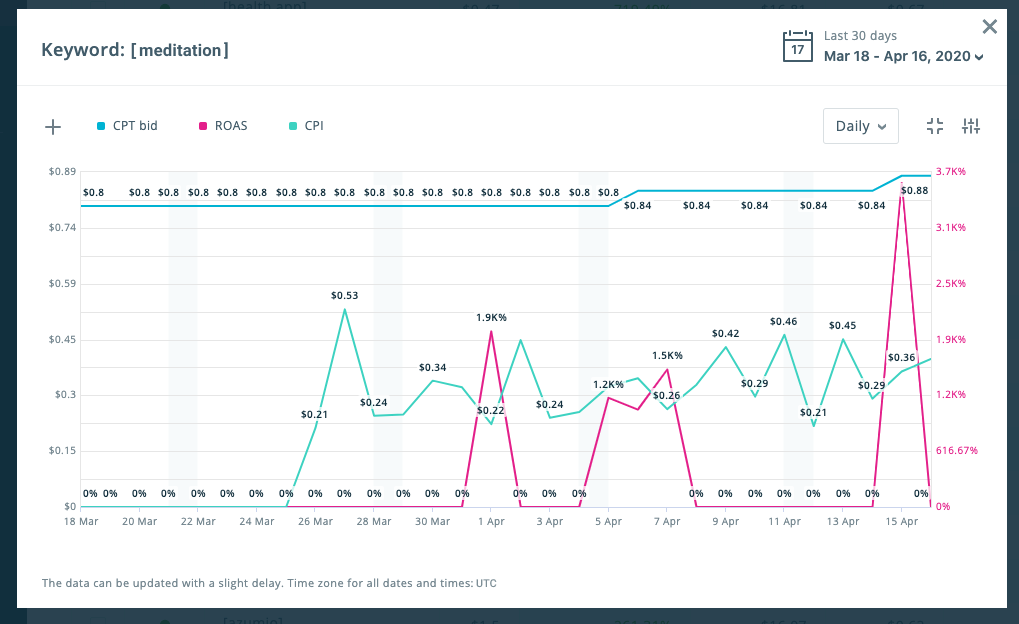
Just click on the chart icon near a keyword, and you’ll get the view of the CPT bid history for the selected time interval on the separate graph.
Apart from the data on CPT, you can add other metrics to this graph, like CPA, TTR, Download rate, Spend and more.
In simple terms, you may track what impact bid changes had on important metrics, like CPA or ROAS.
Tracking keyword bid history allows you to adjust your bid strategy, increase the number of impressions and get more downloads.
This update is also a part of our efforts aimed at enhancing your Apple Ads experience through optimization of graphs in SearchAdsHQ.
We have recently introduced a number of features, so that now you can: