How Sequential A/B Testing Works in SplitMetrics
 Anastasia Sidoryk
Anastasia Sidoryk
Anastasia Sidoryk 
SplitMetrics is excited to announce that our A/B testing platform has switched from the classic approach to the sequential one. From now on, you can test and discover the winning variations of your assets while having an opportunity to:
Want some theory on our new approach? Read on the essentials of sequential A/B testing as well as on its difference from the classic A/B testing method.
Probably the main question about sequential A/B testing is “What’s new in how the winning variation is defined?”
Let’s say you run an experiment for only one pair of variations – control (A) and treatment (B). In this case, as soon as the significance level is detected, a variation with the bigger conversion rate will be declared the winner.
If significance is not found and the experiment hits its time limit or maximum required conversions, the test finishes with no winner.
After the test finishes, what happens with the traffic?
No matter what the reason for the experiment stop is, your treatment variation will be autopaused and the control variation will keep receiving the traffic. This will keep going until you finish your campaign by yourself.
We will send you a notification so that you know when and how the test has finished – with the winner or without it, and which variation has won. You won’t miss on important things happening within your experiment.
When it comes to A/B testing more than two variations (A+B, A+C, etc.), the following results may happen:
In the course of your experiment with more than two variations, our platform can automatically pause a variation when:
The paused variations don’t receive paid traffic while the remaining variations do, which can help avoid insufficient spending.
When all the variations are automatically paused, the traffic will be distributed to the control variation only until you stop your campaign. We will send you an email notification so that you do that on time.
As you can see, the variation pause or the experiment stop can happen for multiple reasons. For you to know the why and when of your A/B tests, we’ve added new status messages to the block on the experiment page. Such transparency will keep you informed on the test progress.
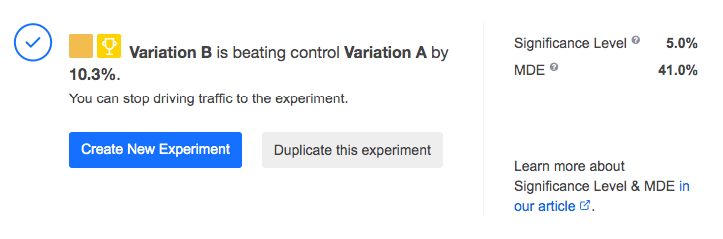
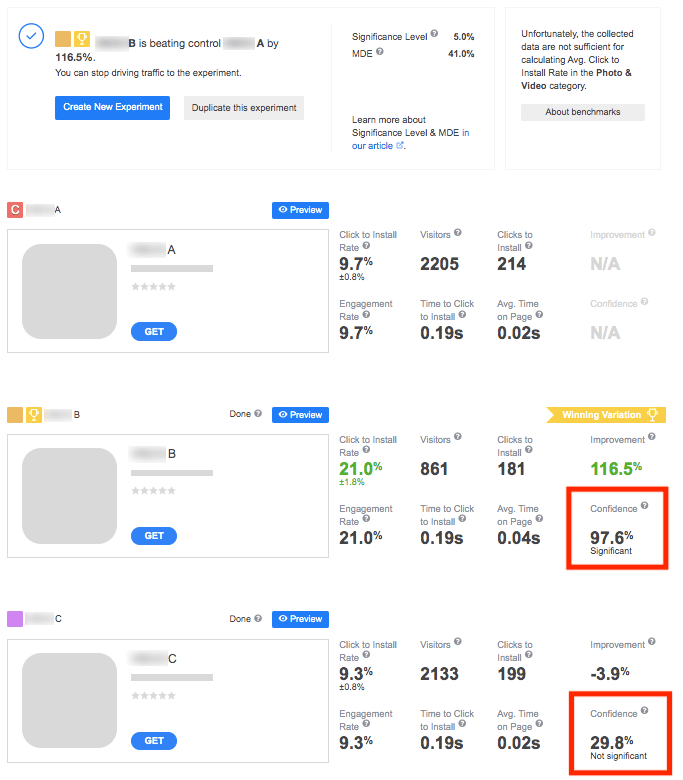
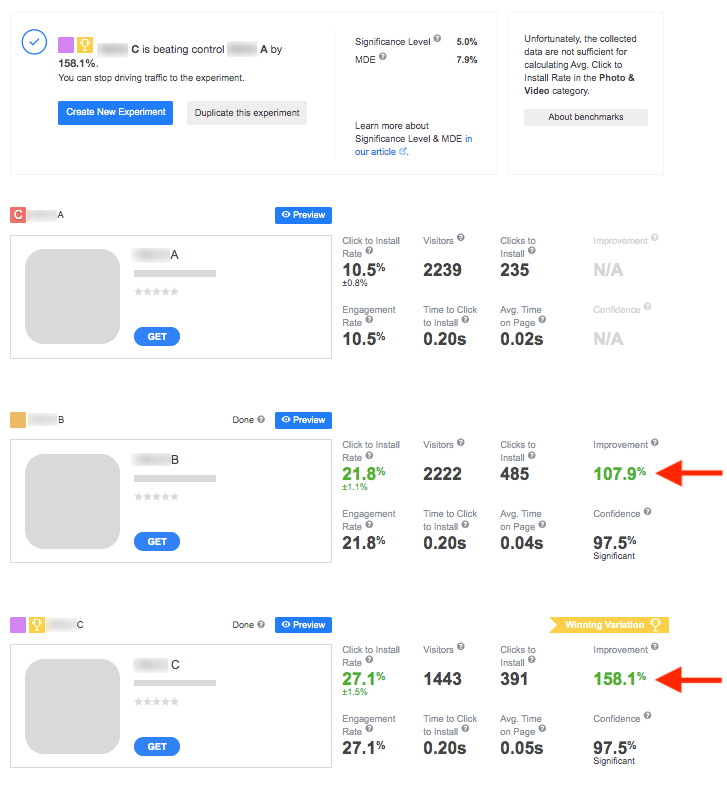
Status message when a treatment variation wins:
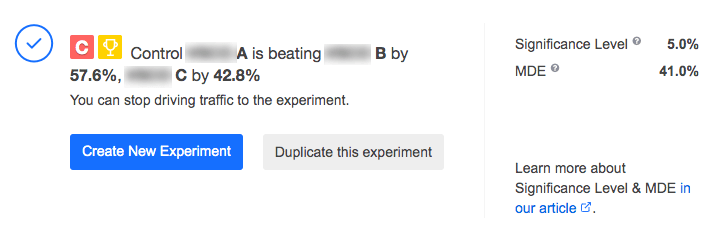
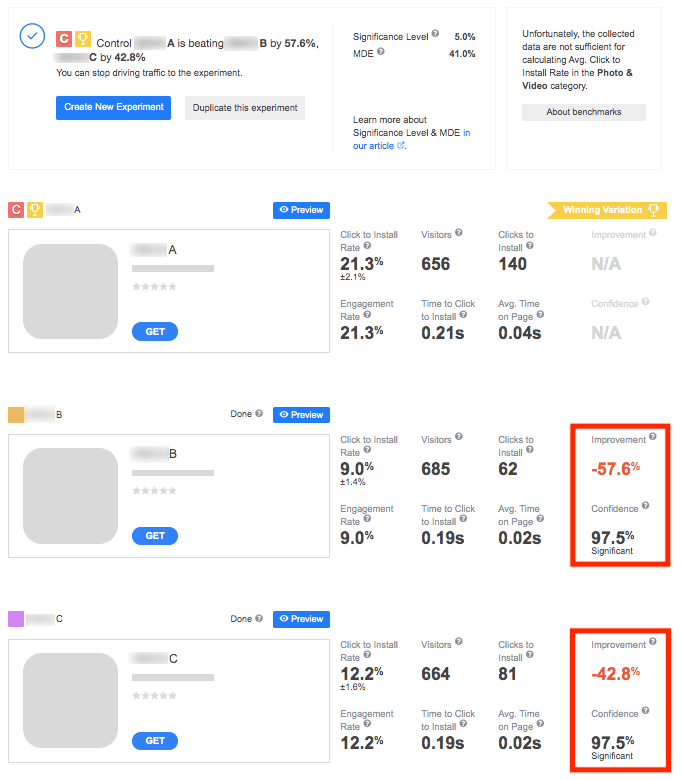
Status message when the control variation wins:
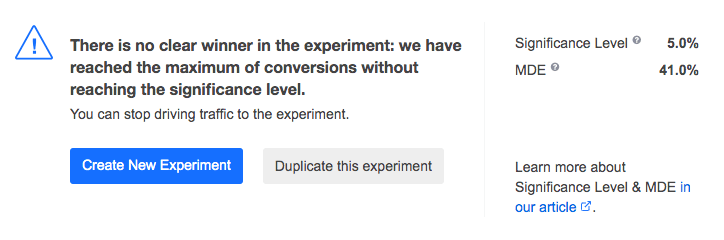
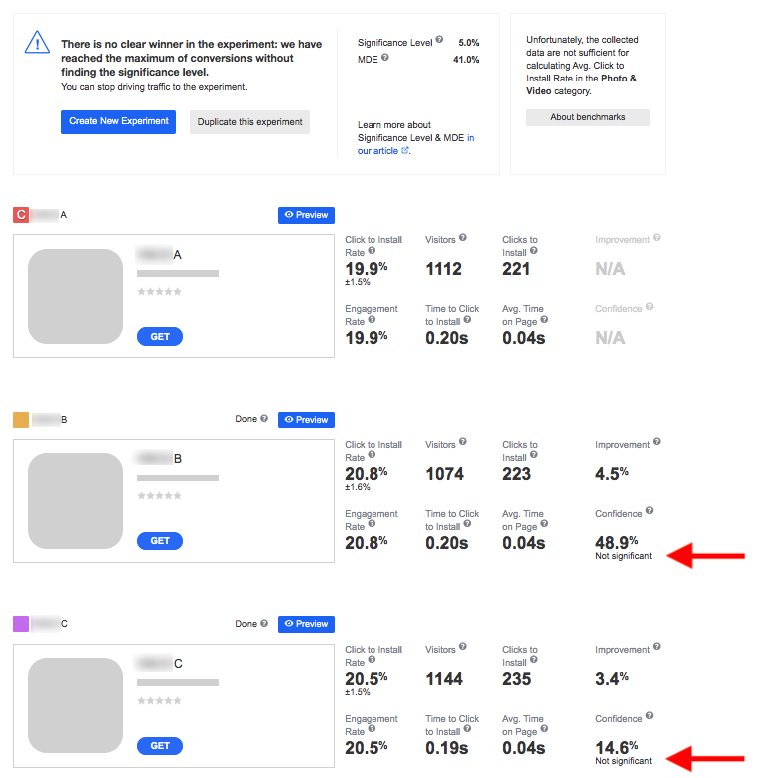
Status message when there’s no winner:
Now that you know the overall principles behind determining the winner, let’s explore what else has changed in the experiment configuration.
After the experiment is created and before you start driving traffic, there are three parameters that you have to configure – Minimum Detectable Effect, Significance Level and Statistical Power.
Proper settings for them ensure that your experiments deliver meaningful results and won’t eat up your traffic acquisition budget. Now let’s explore each of the parameters in the context of SplitMetrics A/B testing platform.
To begin with, SplitMetrics uses relative MDE for sequential A/B testing. Rather than absolute MDE, this parameter sets aside the definition of a baseline conversion rate, while having a noticeable effect on the size of your sample.
To illustrate how relative MDE matters, let’s turn to the Evan Miller calculator for sequential sampling. Look how dramatically the total conversions below differ as we change the value of relative MDE:
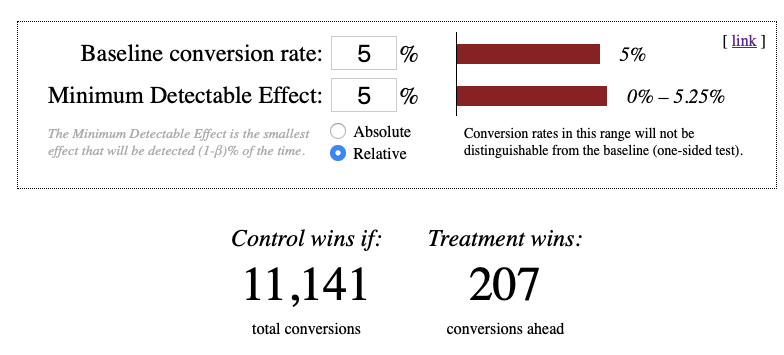
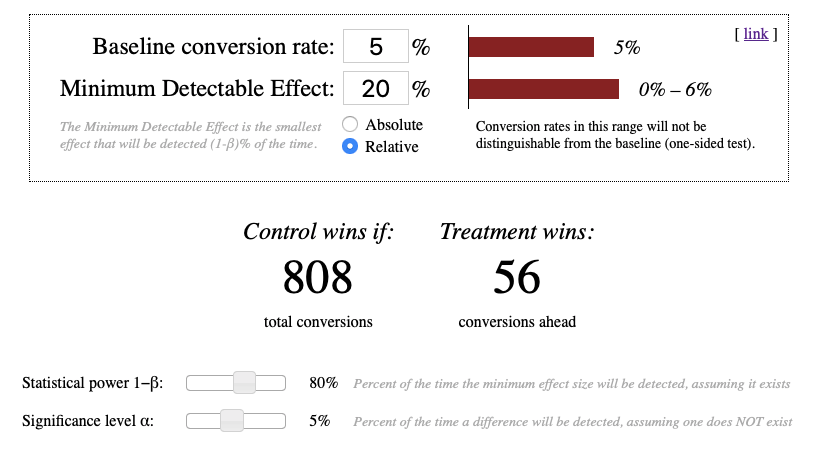
MDE determines the amount of required conversions and, by implication, the costs needed to drive that traffic. Given the importance of this parameter, we recommend setting your custom MDE by yourself.
However, you can entrust our system with the MDE calculations. In that case, our algorithm will rely on your baseline conversion to arrive at your best possible MDE. Your ideal MDE will be the value which produces a sufficiently large sample size, yet comparable to that in classic A/B testing.
If we do the calculations for you, be aware that the result won’t appear straight away. The algorithm will calculate your MDE after your variations gain enough conversions.
Our system offers the following default settings for them:
Both parameters are determined at the experiment level.
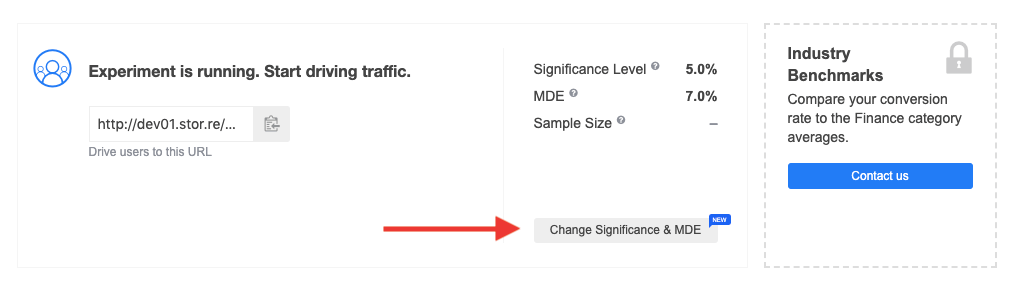
The statistical power can be adjusted by our Customer Success Manager at your request. Significance level and MDE, in turn, can now be configured right from the UI. You can do this by selecting “Change Significance & MDE” in the status block at the experiments page:
Next you’ll see this popup:
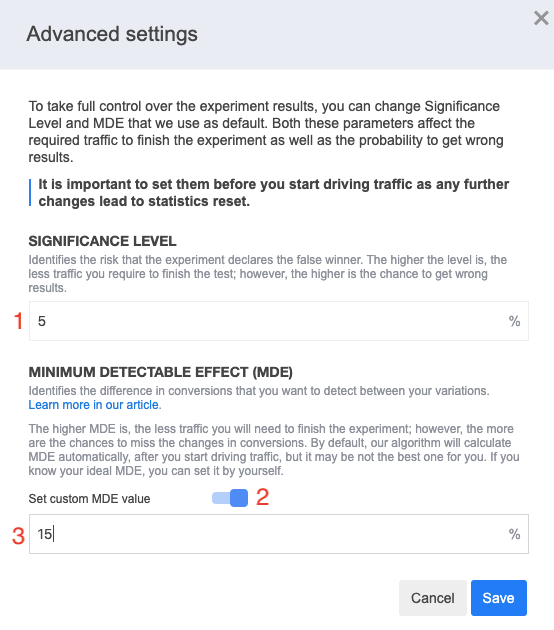
Important! Don’t change MDE, significance level or statistical power after you start driving users to your experiment. If you modify any of the parameters, all the statistics – visitors, conversions, improvement, etc. – will be reset.
Typically, the significance level is set to 5%, meaning that an experiment has a 5% chance of erroneous MDE detection. This is relevant to the experiments involving only two variations.
But what if you want to compare multiple variations?
Each variation has its individual significance level. As the number of variations under testing grows, so does the overall significance level because those individual values accumulate.
For example, when testing A against B, the overall significance level will equal to 5%. However, if we test three variations – A against B and A against C – having the individual significance levels of 5% each, the overall significance level increases to 10%.
With the addition of each new variation, that overall significance will accumulate.
To control the probability of false results, we apply the Sidak correction to the overall significance level. It balances out individual significance levels for variations so that the overall significance level equals 5%.
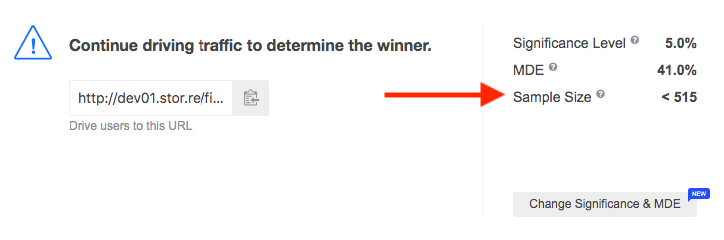
By having your sample size available, you are always aware of how much traffic is left to drive until the experiment is finished.
It’s vital to know that in sequential A/B testing, sample size is only the maximum threshold, but you don’t necessarily have to hit it to finish the test. The experiment can stop as soon as the significance level is detected, even before reaching the maximum of required visitors.
By running sequential A/B tests with SplitMetrics you have a chance of discovering statistically significant results while buying less traffic.
On the other hand, if there’s no significance found and the traffic maximum is hit, it’s time for the experiment to stop.
First, your sample size is gauged in conversions based on your MDE, significance level and statistical power. But after that, we apply your conversion rate to your conversions to arrive at your sample size in visitors. This is how it will be displayed at the experiment page.
These calculations will take some time because we have to receive enough data on your conversions. As your conversion rate may change in the course of your experiment, the sample size fluctuates as well.
For example, you may have the sample size of 100,000 visitors at one point. But later on, it can grow up to 120,000 visitors. Such an increase means that your conversion rate has decreased for one reason or another.
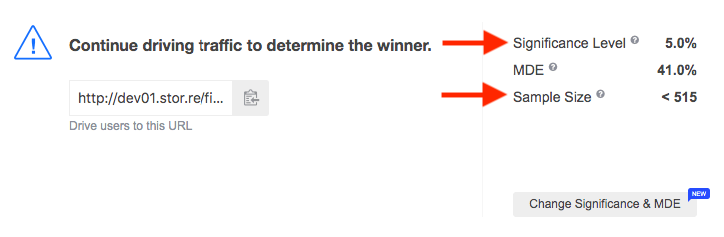
The sample size in SplitMetrics is shown per individual variation (A, B, C, etc.) and for the entire experiment. The maximum total number of visitors needed to finish your A/B test is displayed in the status block at the experiments page above your variations:
The maximum number of required visitors per variation is displayed next to each variation (except for the control one) in the “Confidence” block:
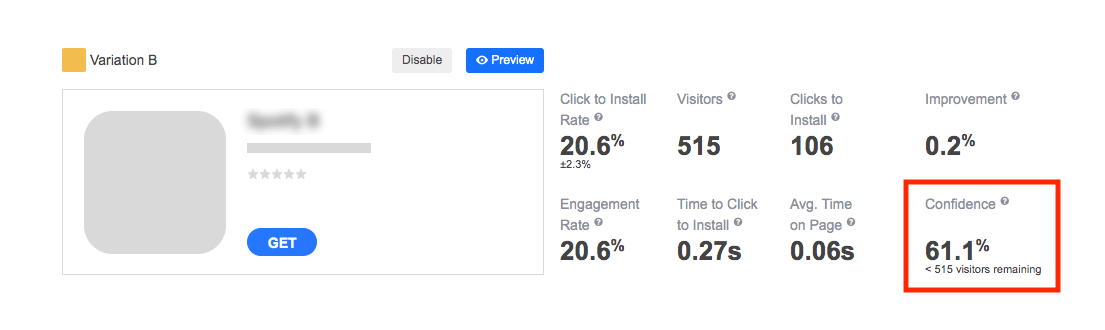
Remember that the value of visitors remaining will increase and decrease as the experiment runs and you drive traffic to it. Your experiment can finish upon the significance level detection before this maximum traffic per variation is reached.
As you can see in the image above, the number of visitors left is displayed next to the confidence level in the “Confidence” block. Similar to the sample size, the confidence level changes in the course of your experiment.
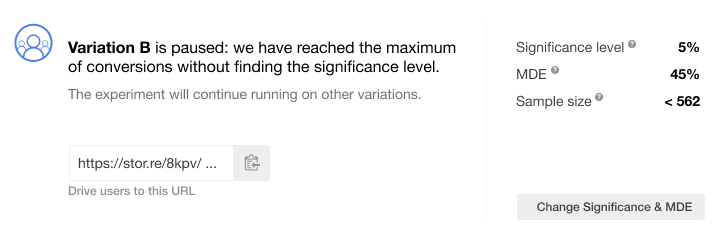
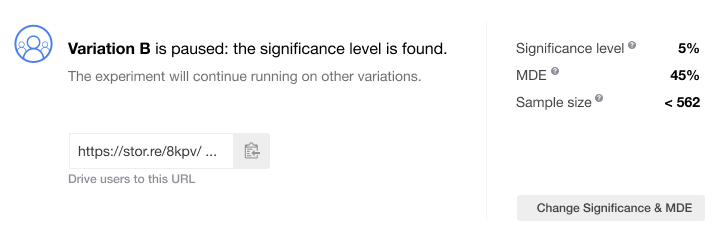
In situations when a variation is paused, confidence level will be shown as a static percentage along with the status “Significant” or “Not significant”:
The best part about sequential A/B testing is that it checks variations for significance and traffic along the experiment. When a test includes more than two variations, the SplitMetrics algorithm will repeatedly do the checks and pause a variation in two cases:
In either of the situations, you will see a status popup with the reason for a pause. For example:
Remember that the traffic will no longer be driven to the paused variations, which helps cut your expenses. The remaining variations will keep receiving traffic until they reach the maximum of conversions or significance is found for them. When all the variations have been paused, the traffic goes to the control variation only until you finish your campaign.
Here are the scenarios of how your test may finish:
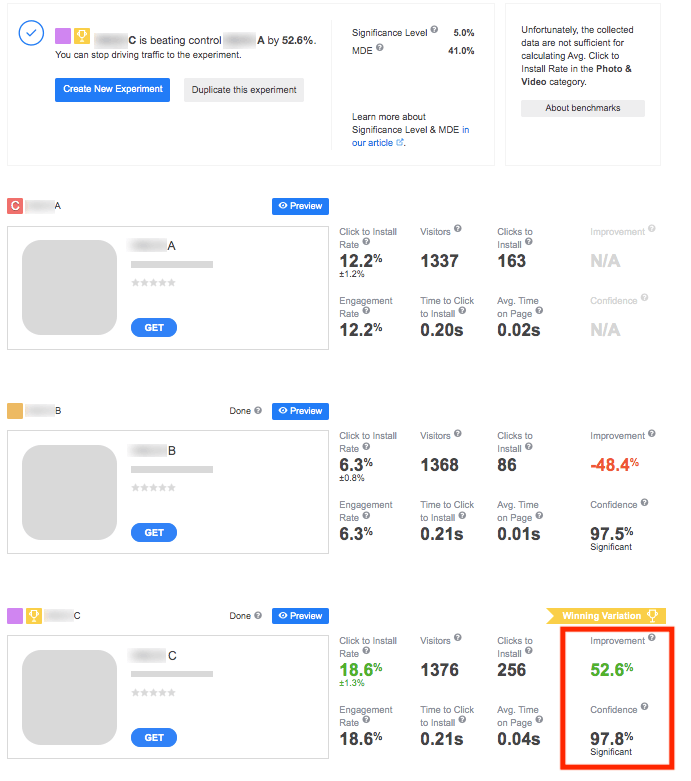
What if significance is found for several variations which outperform the control one? In such situations, the comparison of conversion rates comes into play. Let’s illustrate this with an example.
Suppose you run an experiment including three variations – A (control), B and C. Following the sample size calculations, 808 is the maximum of conversions required per pair of variations. What happens next?
Naturally, all the above stages will be accompanied by the status messages so that you know what happens and why:
To sum it up, sequential A/B testing can come as a real saver of time and marketing budget. You can now enjoy all the advantages of this method when running your experiments with SplitMetrics.
If you still have any questions on how it works in the platform, feel free to contact your manager.