A/B Testing — 9 Jul 2019
Sequential A/B Testing: Workflow and Advantages over Classic Experiments
 Liza Knotko
Liza Knotko
Liza Knotko 
When it comes to A/B tests, anyone has a natural desire to get trustworthy results without spending a heap of money on traffic. Alas, it’s not always possible with classic A/B testing which requires enormous sample sizes at times.
Is there a better way? Sure, there is!
Sequential A/B testing might become a robust alternative. Such experiments don’t only optimize necessary traffic volumes but also reduce the likelihood of mistakes. If you feel like exploring how it works in our platform, read on SplitMetrics sequential A/B testing principles.
Nor, let’s take a closer look at this method theoretically and learn how it differs from the classic A/B testing flow.
Before proceeding to sequential A/B testing, let’s spare time to brush up our understanding of a classic A/B test. Its principles are quite straightforward:
There are a few common rules when it comes to classic A/B testing:
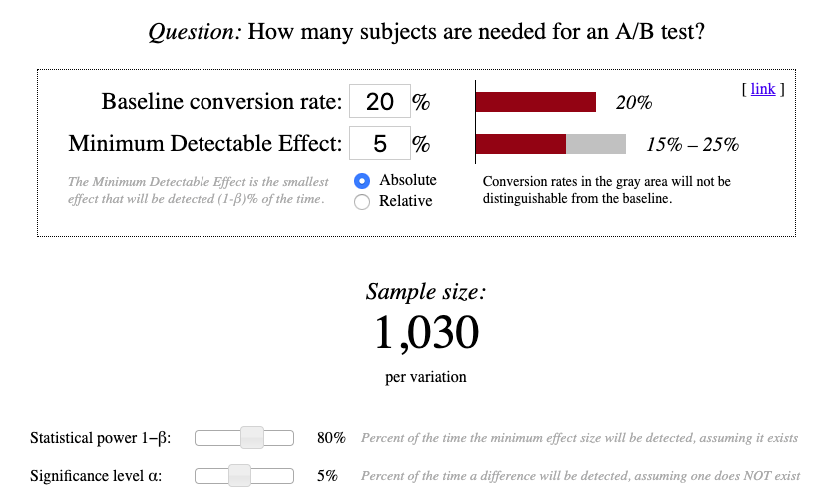
The higher your baseline conversion rate, the less traffic you need to find a statistically significant difference.
For example:
The higher the expected conversion lift, the less traffic you need.
This aspect once again proves the importance of a strong hypothesis which potentially causes a greater difference in variations performance. Judge for yourself, sample size discrepancy might be truly dramatic:
A considerable amount of required traffic isn’t the only issue with classic A/B testing. A lot of managers violate core principles — they make conclusions before reaching the necessary sample size for all variations under test and finish the experiment earlier. They go even further at times and keep stopping and launching one of the alternatives multiple times within one A/B test.
There is another common scenario — unsatisfied with their hypothesis not being proven, managers keep filling failed experiments with traffic in hope for a change. Needless to say, it’s a reckless waste of money which has nothing to do with getting quality statistically significant results.
In the end, such cases of poor individual initiative increase the chance of mistake (significance level). For example, from totally acceptable 5% this parameter may reach, let’s say, 12% waving goodbye to the hope of trustworthiness.
It’s vital to understand that only responsible approach and observance of all rules give ground for meaningful results. Any violation of the classic A/B testing workflow screws up your experiment.
Good news is that classic A/B testing can be modified. Such updated approach is known as sequential A/B testing.
The best part about sequential A/B testing is that it gives users a chance to finish experiments earlier without increasing the possibility of false results. Sounds great, doesn’t it? Now let’s figure out how this type of testing works and what makes speedy results possible.
As it was mentioned above, when it comes to classic A/B testing, it’s allowed to check test results only at the very end when the sample size for both variations is reached. Sequential A/B testing in its turn allows multiple checks on every step ensuring that error level won’t exceed 5%.
The workflow of tests with sequential sampling starts as classic A/B testing — with defining sample size using a specialized calculator.
Сalculations are made for a one-sided test in this calculator. It is called one-sided as it helps to check if the critical area of a distribution is either greater than or less than a certain value, but not both. Let’s analyze an example to see when we need one-sided tests and when two-sided ones.
Imagine we believe that our control variation A performs worse than variation B. Therefore, A > B is our null hypothesis (the one we’ll try to reject via A/B testing):
To reject a certain percentage of observations, we have to define the parameters we need for a sequential A/B test:
Minimum Detectable Effect (MDE) — a minimum improvement over the baseline conversion that you’re willing to detect in an A/B test. It’s better to opt for Relative MDE as it allows you to skip defining of the Baseline conversion rate. This parameter is critical for your experiment as it favors precision. Let’s say, your MDE is 10% and your A/B test showed the following results:
Such results fail to detect a meaningful difference between variations as with relative MDE=10% the system treats 50% as 45%.
Significance level (α) — the probability of the null hypothesis being rejected while in reality, the null hypothesis is right. Simply put, this is the chance of false results of our A/B test. Going back to the example above, this parameter defines the percentage of time when the test proves that A≤B while in reality A>B. 5% is the optimal significance level for A/B testing.
Statistical power (100%—β) — the probability of the null hypothesis being rejected while in reality the null hypothesis is indeed wrong and our initial presumption was correct. 80% is the optimal power for A/B testing.
Even though the significance level is more important than statistical power when it comes to A/B testing, a meaningful experiment is impossible without proper statistical power.
Now let’s examine each step of the sequential A/B testing procedure:
Detailed calculations which support this workflow can be found in this article by Evan Miller.
Imagine that your baseline conversion is 2%. Let’s calculate the sample size for a classic A/B test based on this parameter:
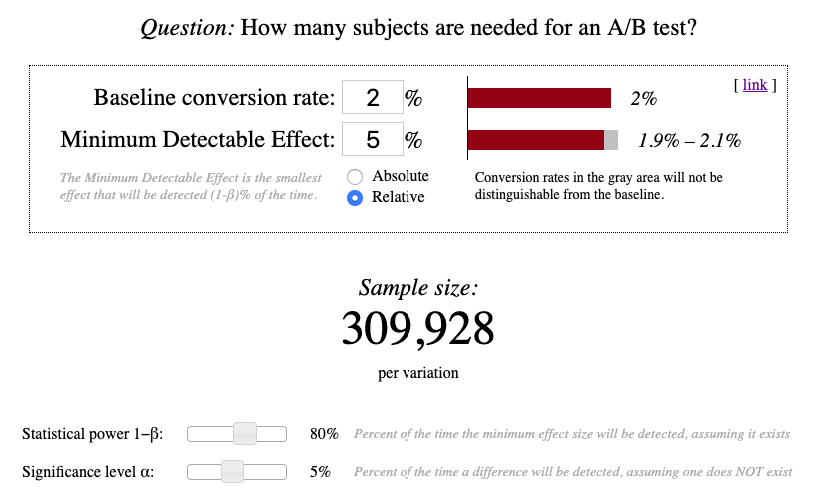
We launch our experiment and wait for each variation to have at least 309,928 visitors. Only then we can get down to analyzing the results.
Assume that each variation had 310,000 sessions after 7 days of our A/B test:
Let’s use this data estimating our results with help of Chi-Squared Test calculator:
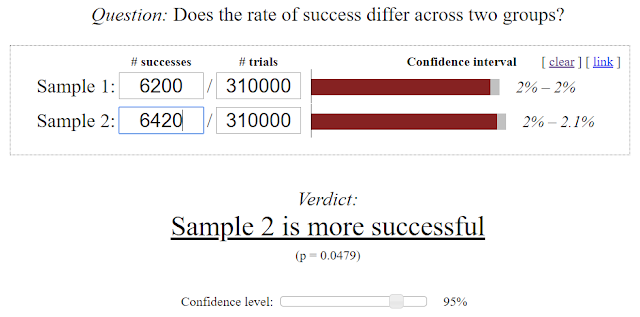
The calculations show that variation B won and the test can be finished. The total number of conversions was 12,620 (6,200 + 6,420) and the difference between variations was 220 conversions.
Considering that for a successful experiment the chance of mistake (p-value — the worst-case probability when the null hypothesis is true) shouldn’t exceed 5%, the 218 conversions difference was enough for statistical significance of our A/B test.
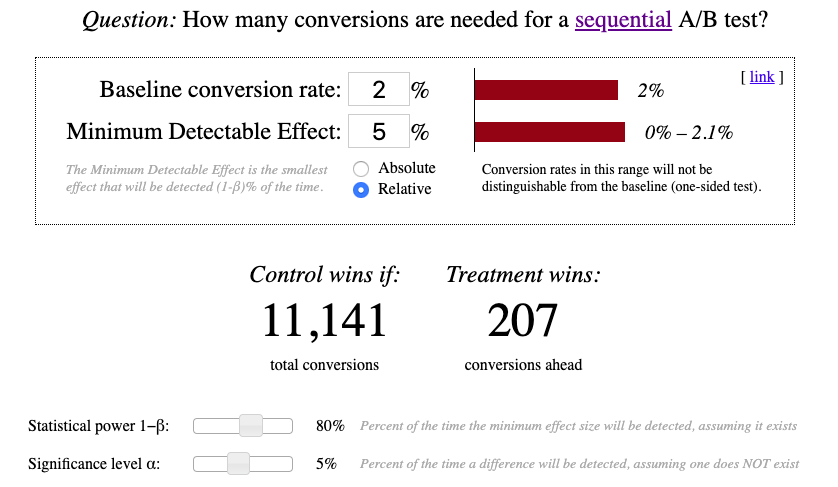
Now let’s run sequential A/B test using the same baseline conversions and MDE. Sequential Sampling Calculator helps us define stop configuration which defines when our test can be finished.
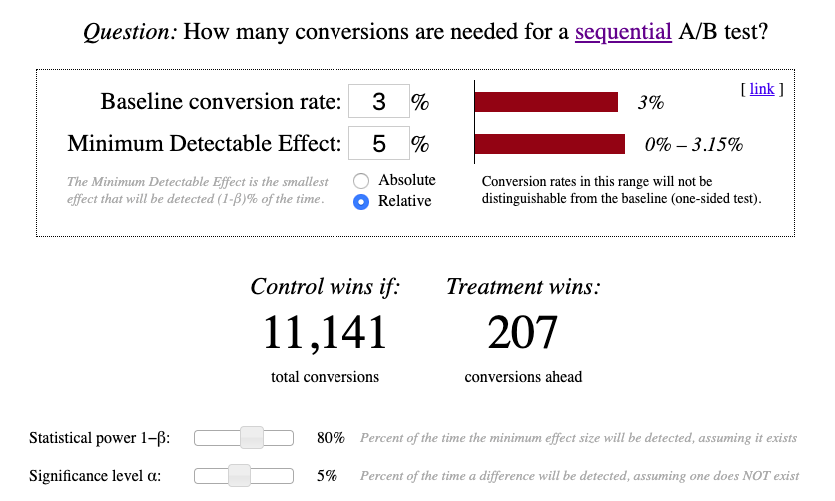
Assume that after 5 days of this test we got the following results:
The sum of conversions is 11,141 (5,460 + 5,681) and the difference between variations performance exceeds 207. Thus, the test can be finished.
If we compare these two experiments we’ll notice that sequential A/B testing helped to reduce the number of required conversions from 12,620 to 11,141 (12%) and take minimal required conversion difference from 218 to 207.
Furthermore, the calculations by Evan Miller demonstrate that:

Considering fairly low conversion in such popular app categories as games or photo & video, sequential sampling is an amazing opportunity to speed up results getting in the context of mobile A/B testing.
If you feel like trying this kind of experiments, read about how sequential A/B testing is implemented in SplitMetrics!