A Digest of SplitMetrics Benchmarks for Product Page Ads Report
 Gabriel Kuriata
Gabriel Kuriata
Gabriel Kuriata 
Product page ads on the App Store were officially introduced in November 2022, along with those featured on the platform’s Today tab. This pushed the total number of available ad placements to four, allowing app marketers to reach out to App Store users throughout multiple stages of their customer journeys.
Since then, more apps began to gradually embrace multi-placement strategies, by launching campaigns for all available formats to take advantage of the synergy between them.
In order to help even more app developers adopt additional placements, we’ve released the “Apple Ads Product Page Benchmarks Report”, based on our own data from campaigns managed via SplitMetrics Acquire.
We hope our benchmarks will help you understand what goals can be set for the new placement, and what can be expected in terms of return on investment. For product page ads, the understanding of the synergy between placements and the knowledge how to track it, is necessary for proper assessment of our benchmarking data. This is why we examine these topics in this article too. Additionally, in the report, experts from SplitMetrics Agency share even more ideas for making product page ads an important piece of your user acquisition efforts.
This article is an abridged version of our “Apple Ads Product Page Benchmarks Report” released in September 2023. For even more data & insights on product page ads and multi-placement campaigns, access the full document on our website.
According to SplitMetrics’ data on Apple Ads product page ad campaigns for November and December 2022 through H1 2023, key benchmarks were as follows:
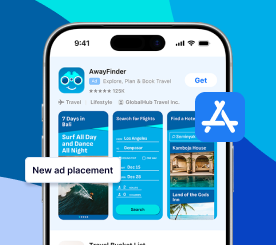
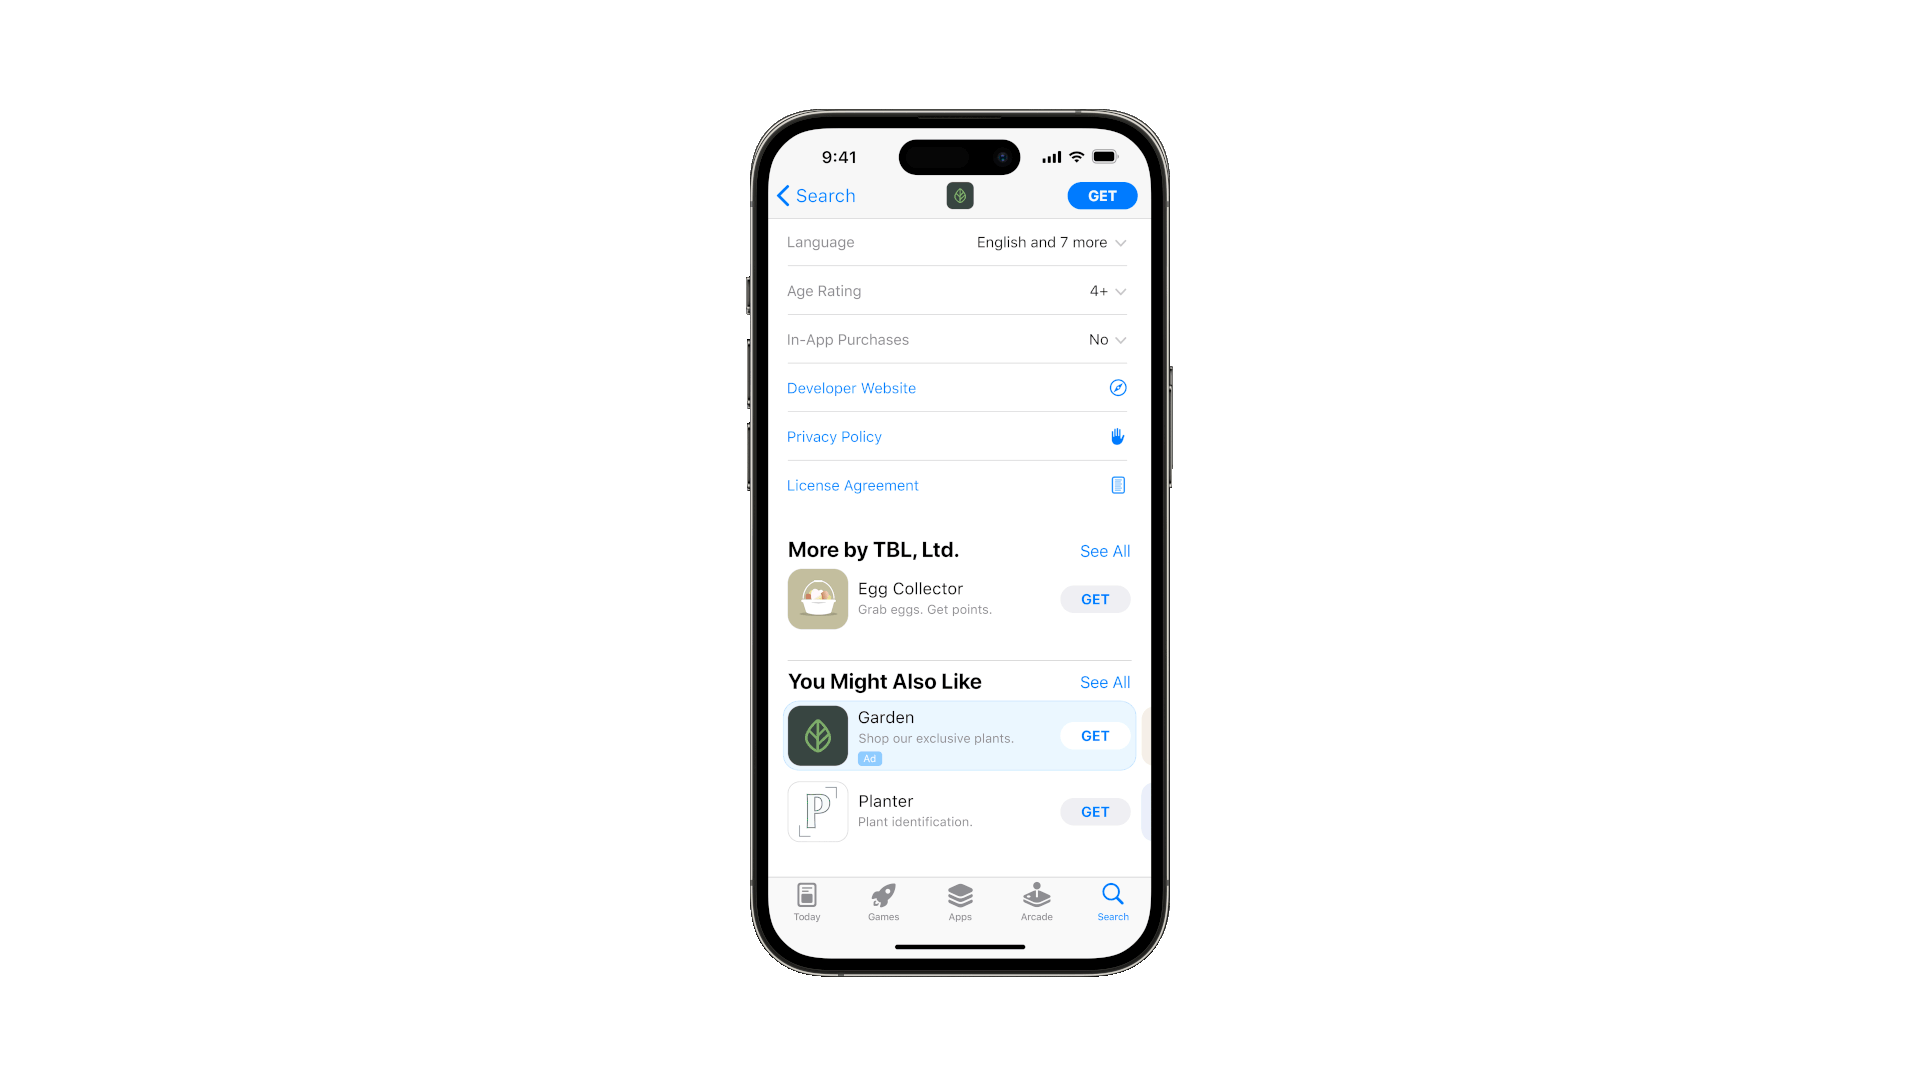
Product page ads are displayed near the bottom of an app’s page, at the top of the “You might also like” section. They’re intended to capture the attention of browsing users, who are actively examining an app before deciding to download it. In that crucial window of opportunity, ads on product pages are meant to show them alternative apps.
Ads on product pages have the potential to be an important cog in the bigger system that is Apple Ads. Continue reading to find out how they can fit in a marketing and user acquisition plan.
SplitMetrics Team analyzed the performance of Apple Ads product page ad campaigns since the placement’s introduction in November 2022, up till the end of May 2023.
Aggregated data represents the performance of apps that manage and optimize Apple Ads campaigns using SplitMetrics Acquire. Overall, we’ve analyzed campaigns that generated:
All this across 13 categories in 61 countries.
The average TTR for ads on product pages in Apple Ads was 2.02%. In that group, Productivity apps enjoyed a no.1 TTR of 2.89%, while Lifestyle apps sat at the 13th place with 0.95%.
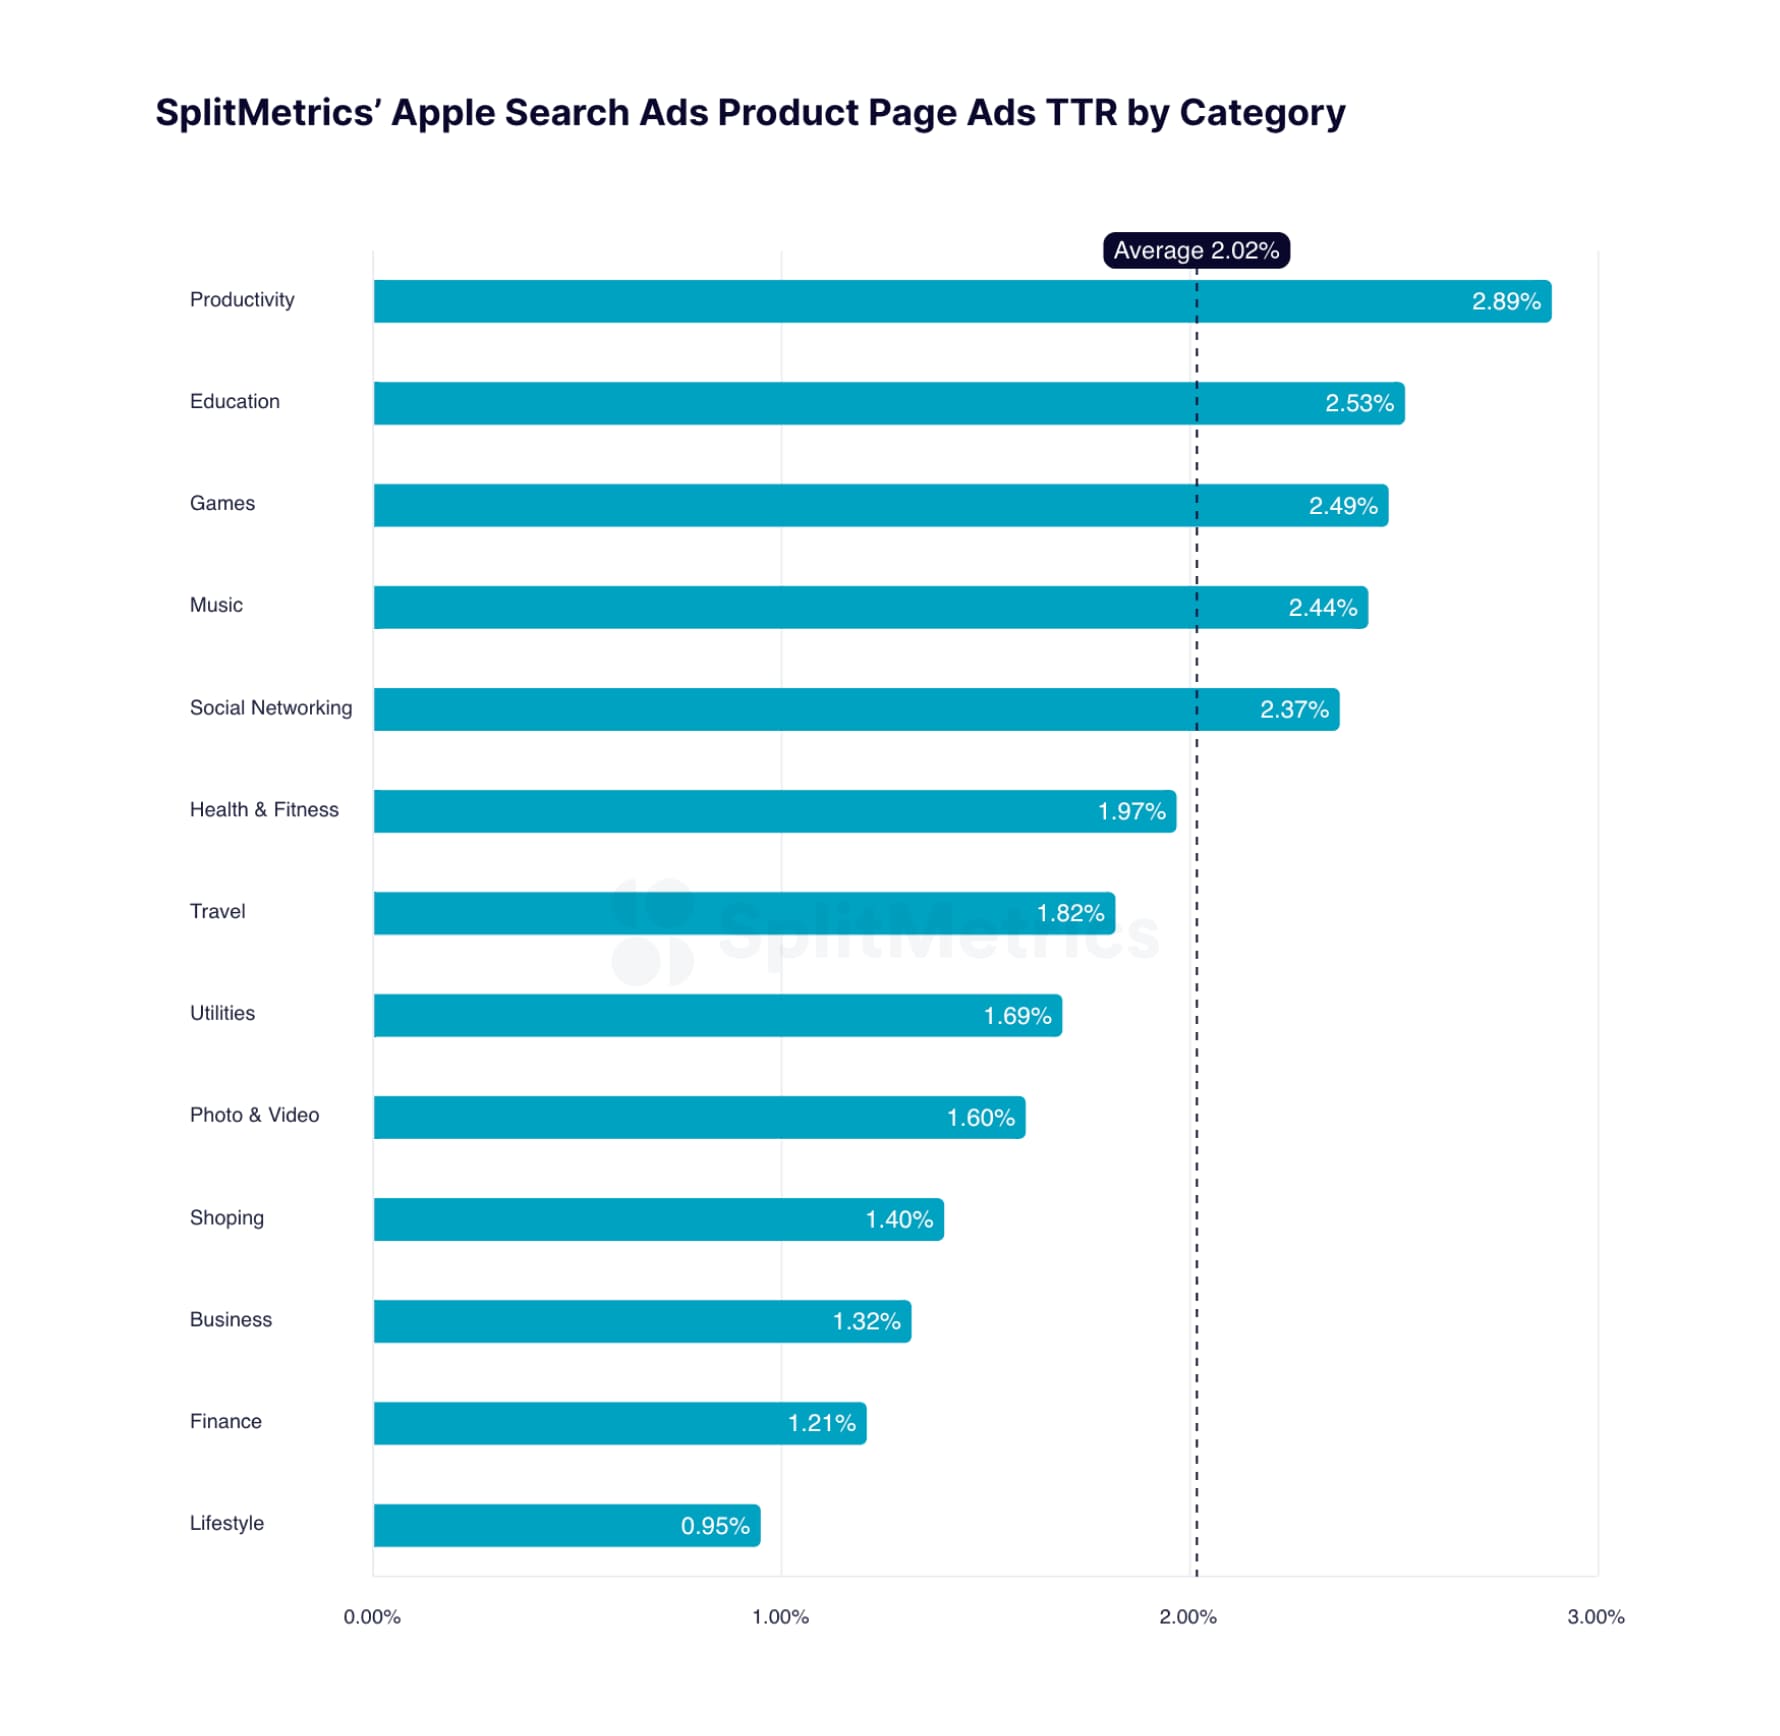
The relatively high TTR for Productivity apps can be explained by the specifics of their audience’s customer journey. Users interested in these types of tools or services are more likely to explore multiple options before committing to a specific app.
The average conversion rate for ads on product pages was 14.47%. Social Networking apps had the best CR at 29.17%, while Utilities claimed the 13th spot with 3.40%.
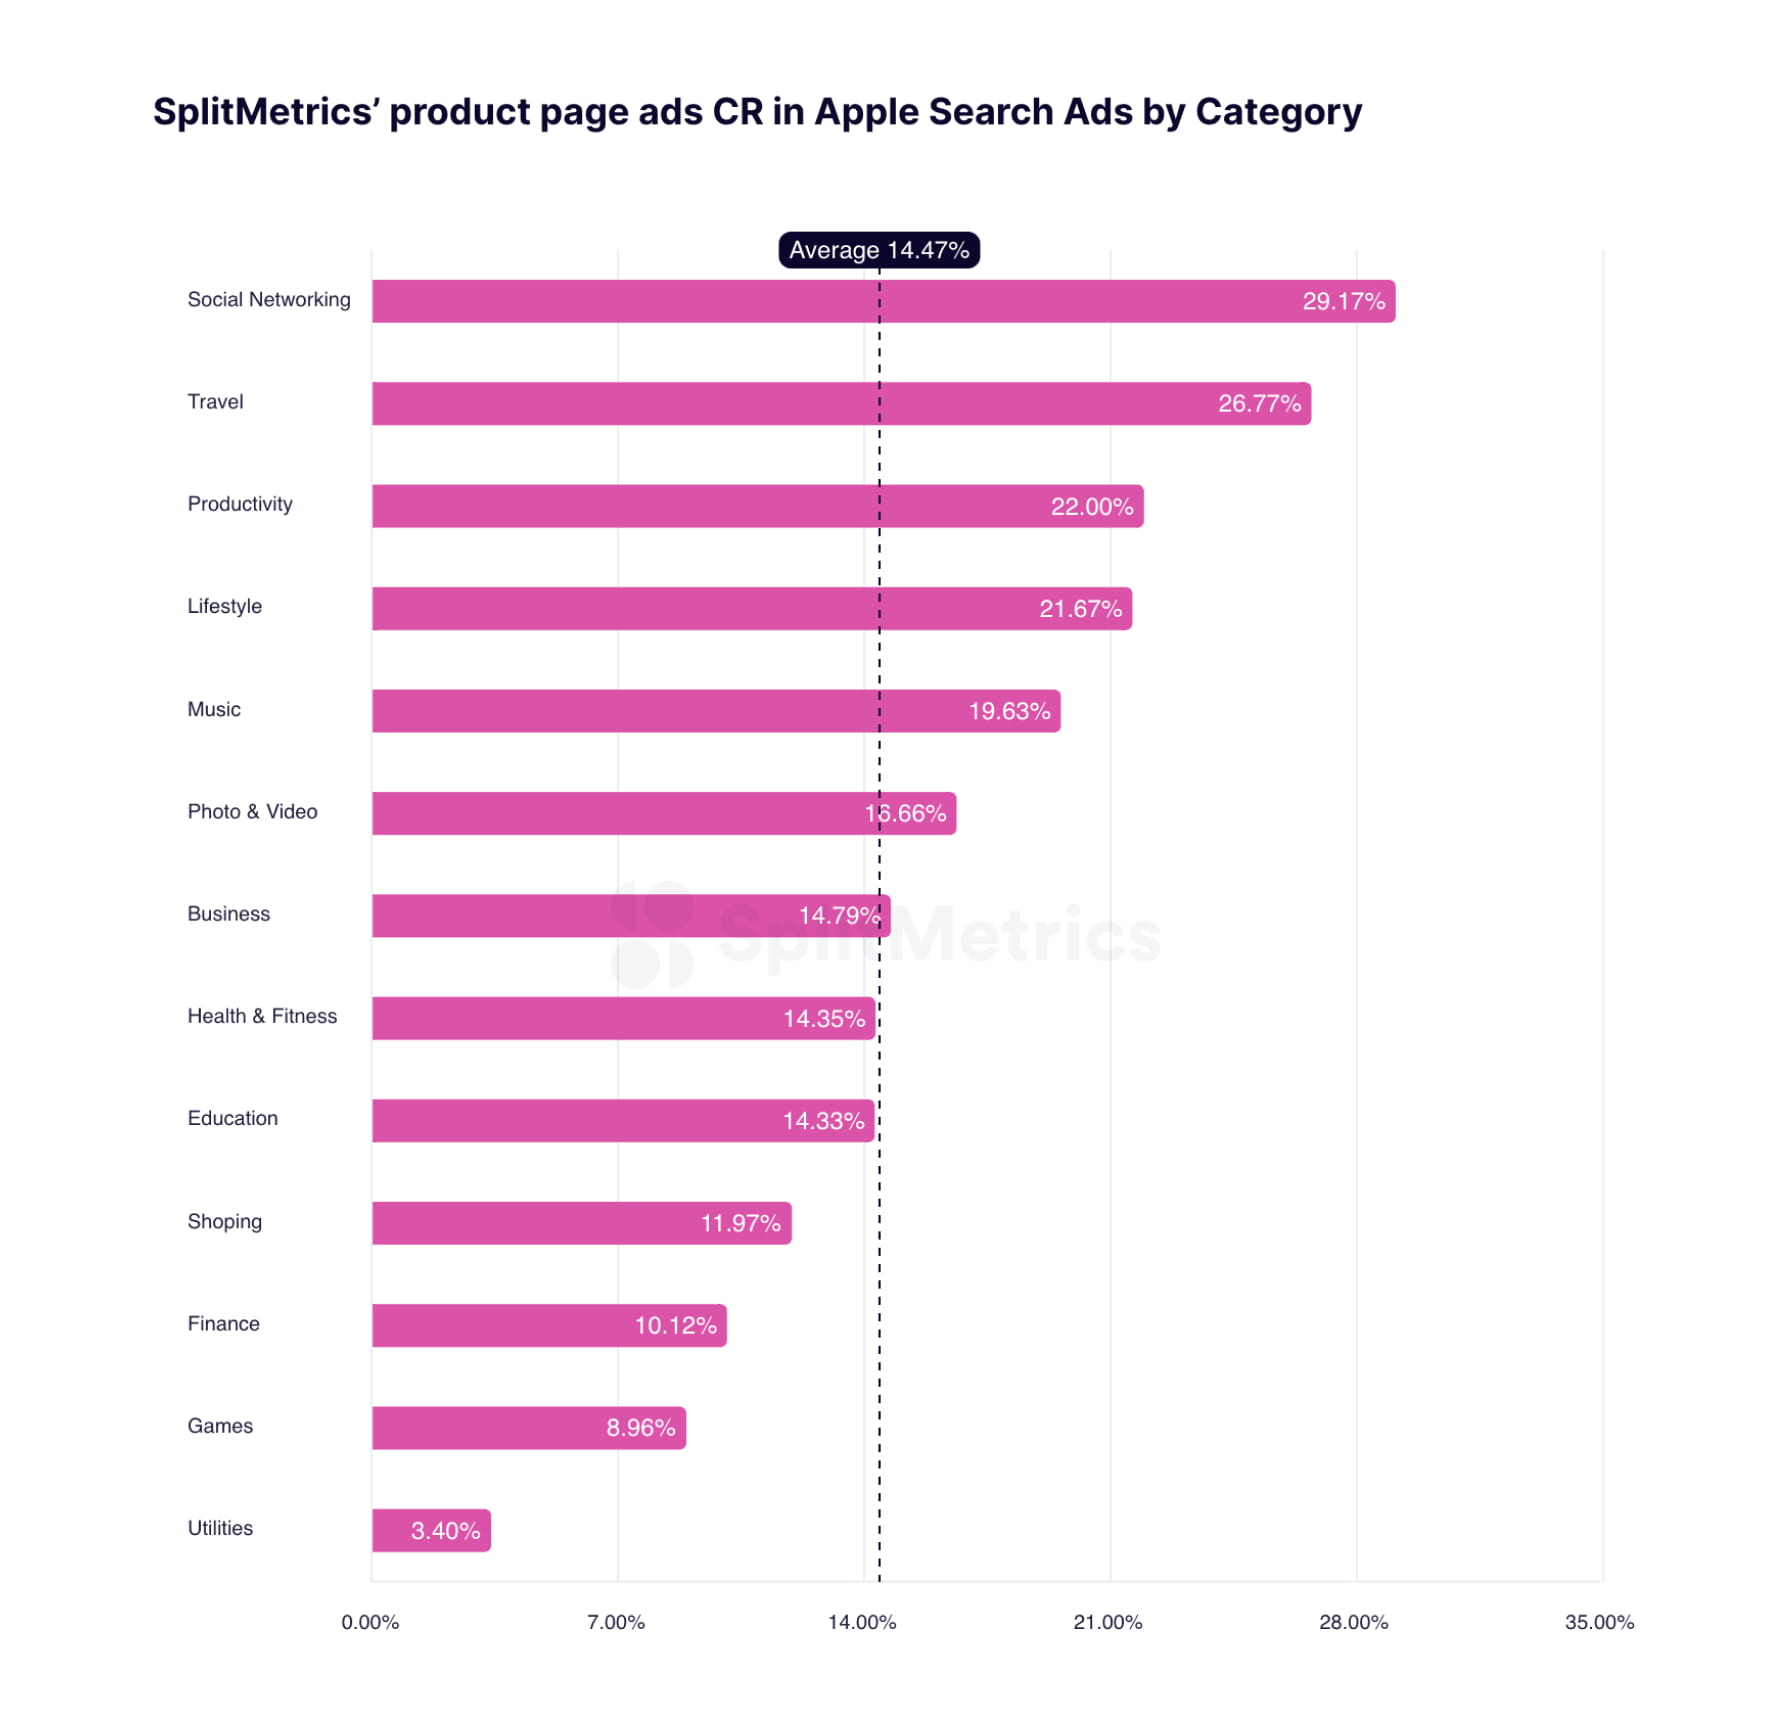
Such a performance for the Social Networking category might be justified by its diverse portfolio of recognizable brands. A familiar brand in the “You Might Also Like” section can induce users to instantly download it.
The average CPT was $1.06, which is lower than CPT for search results campaigns ($1.99), according to our latest “Apple Ads Search Results Benchmarks Report“.
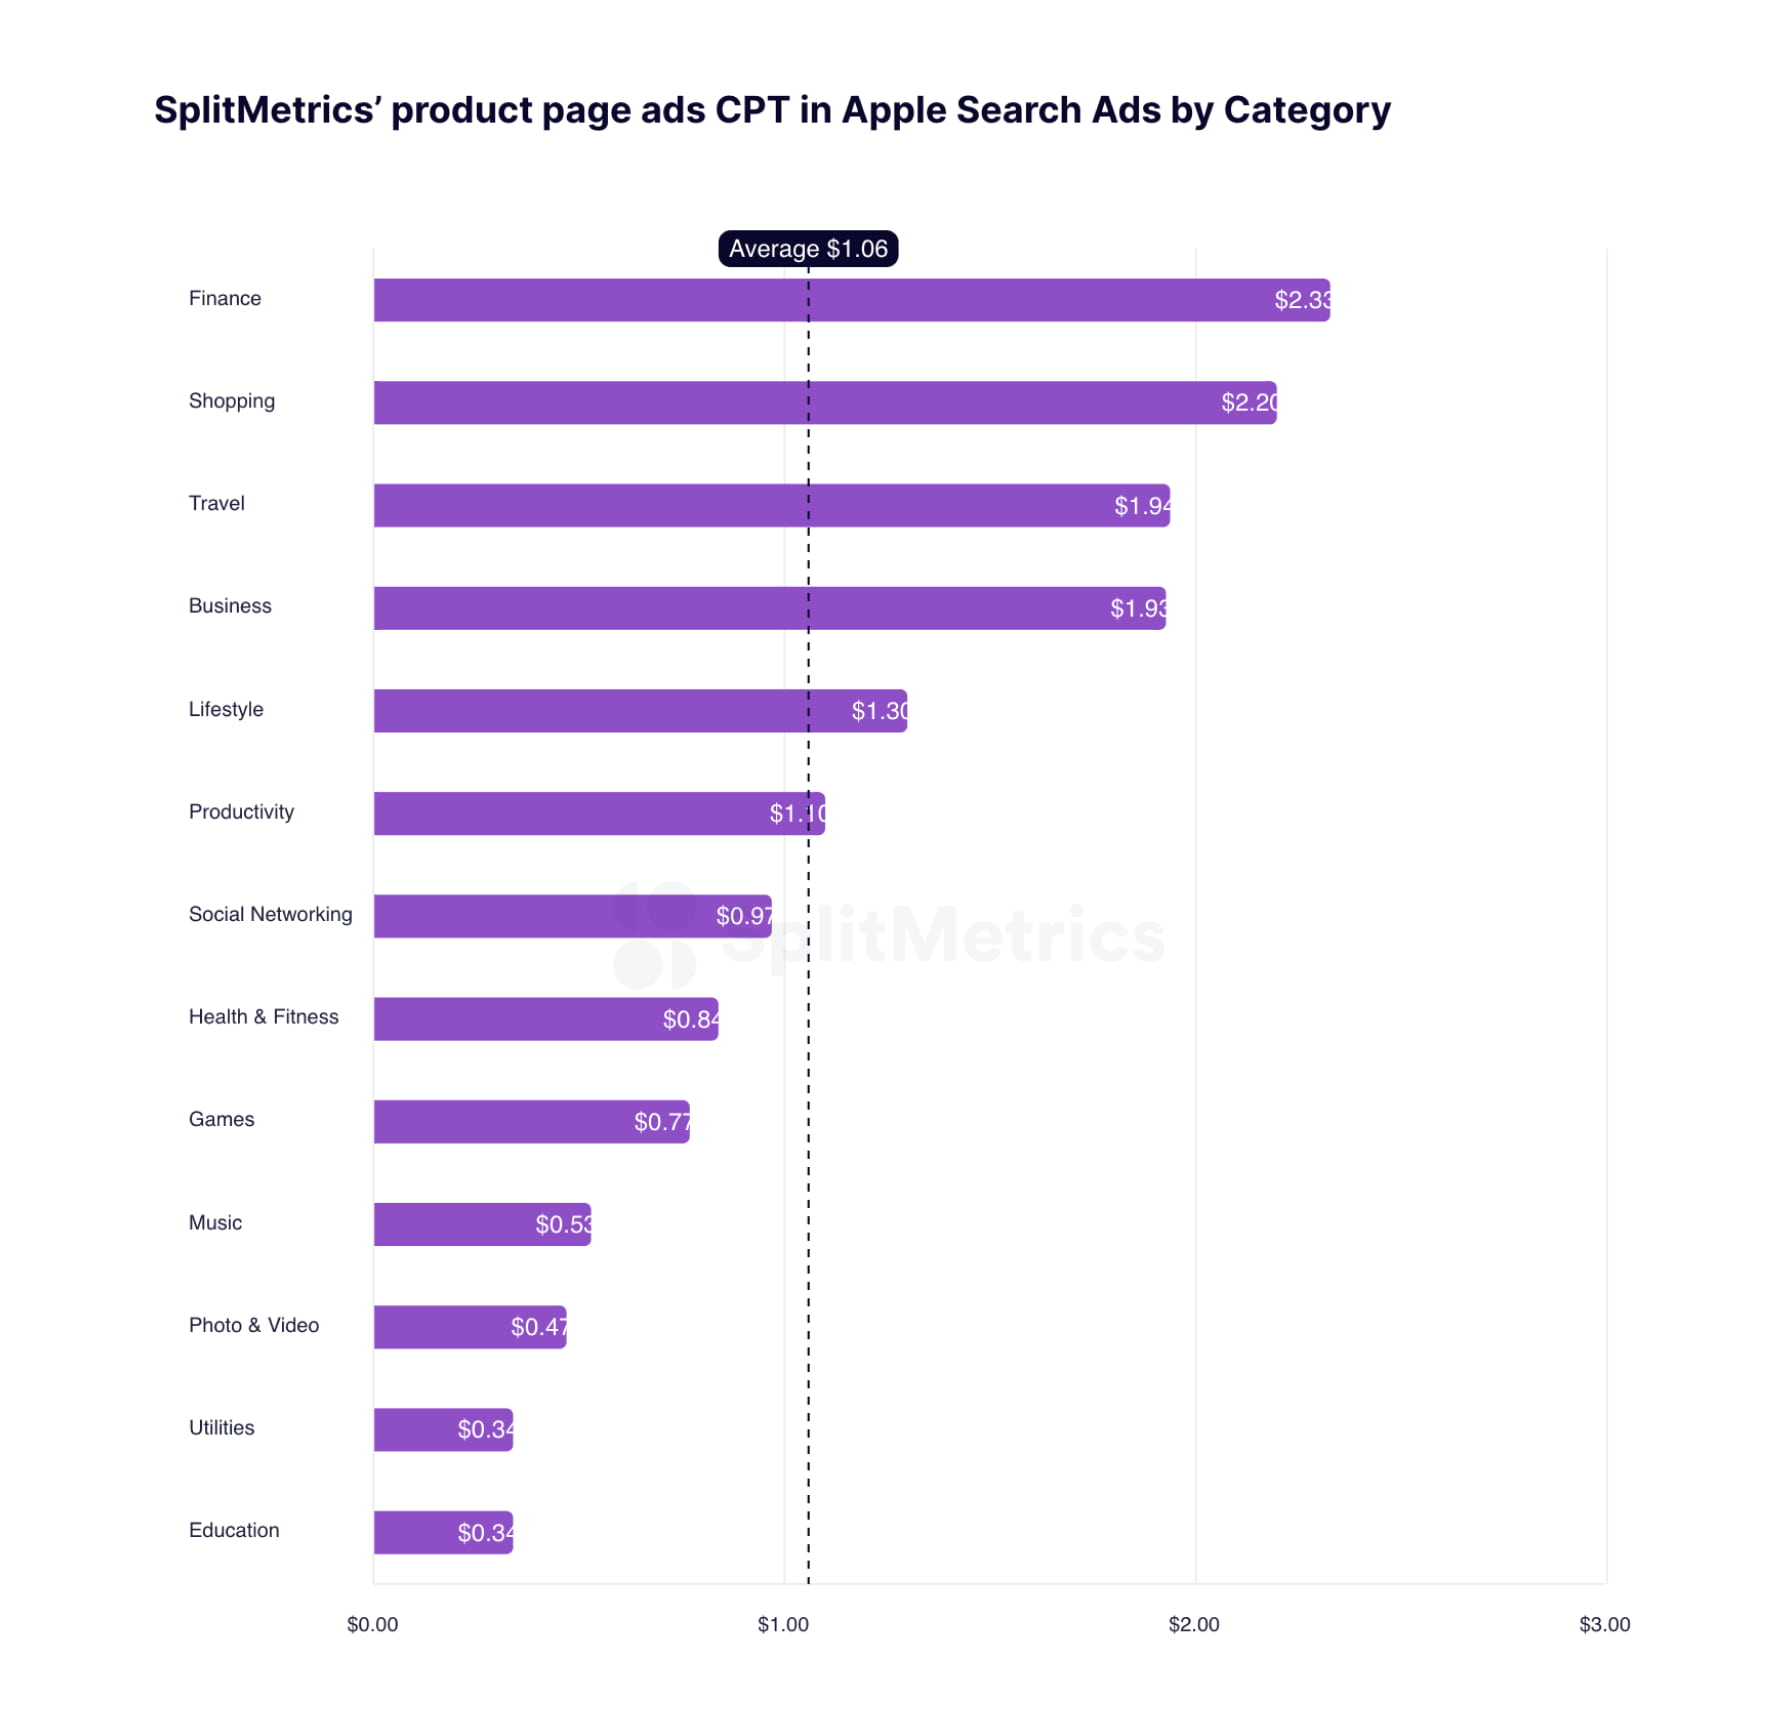
Taps in the Finance category were the most expensive at $2.33, while for Education concluding the top 13 they came at $0.34.
The high CPT for Finance is not a surprise, as a similar trend is visible in our data for search results campaigns. For comparison, Finance was the most expensive category in search results, with CPT at $6.54 the second half 2022.
The average CPA for the top 13 app categories reached $8.27. However, an average acquisition cost $23.01 in the Finance category, while for Education it was $2.47.
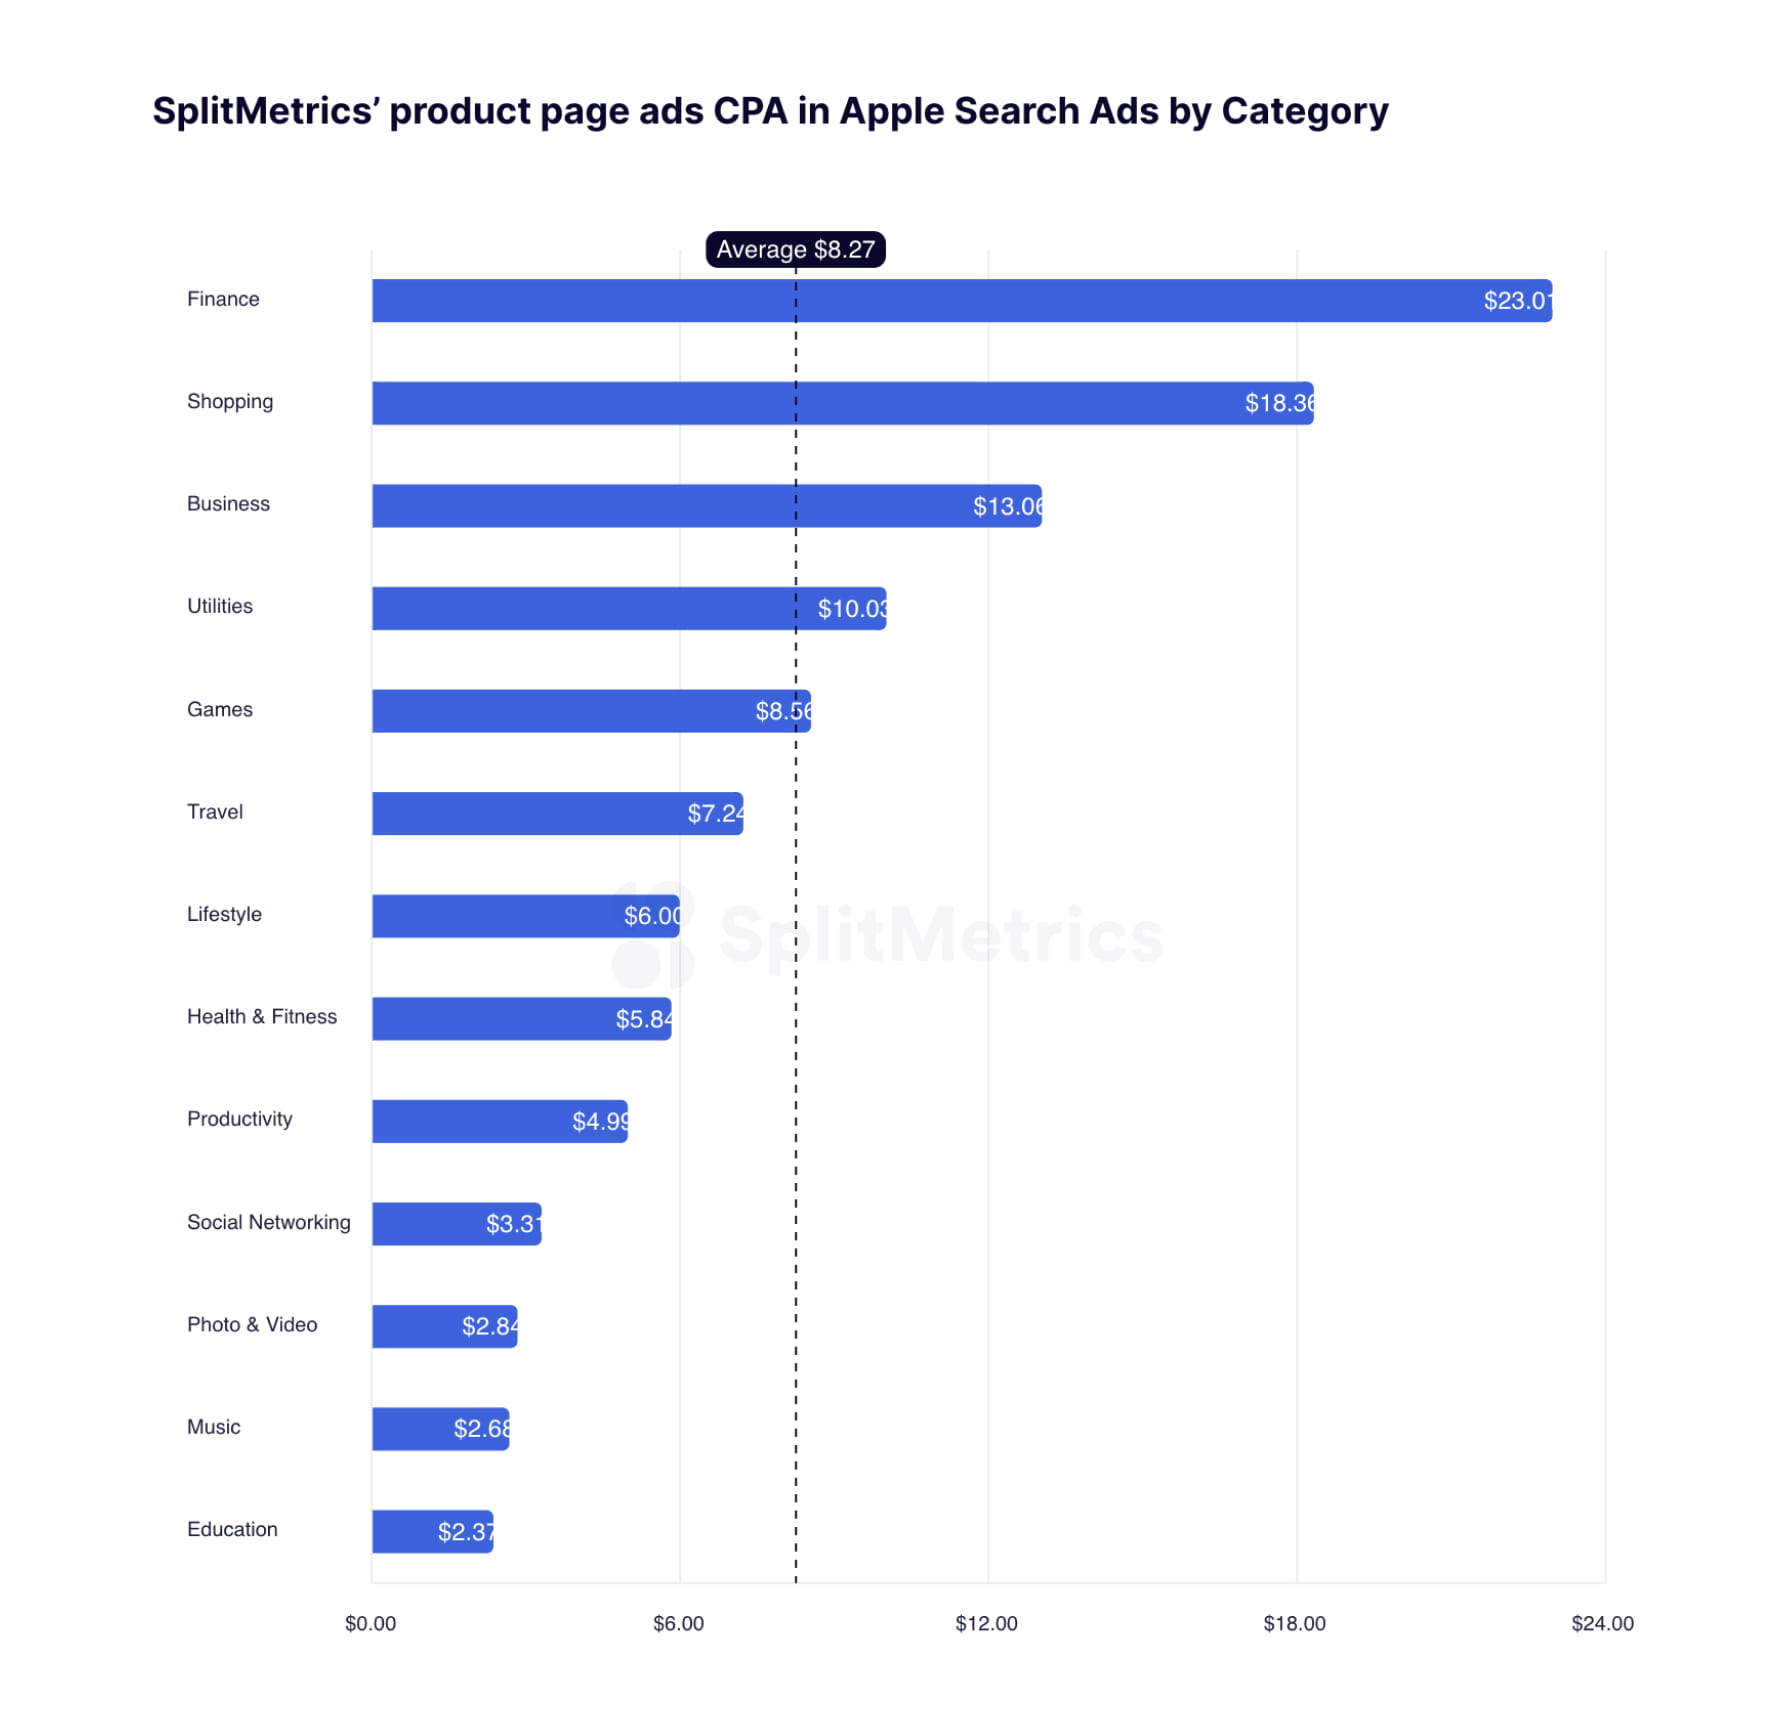
Such results aren’t unique to this placement. Finance is a very competitive category, with taps and conversions being the most expensive for ads in search results as well.
It shouldn’t be a surprise that the USA is the most expensive country in terms of taps ($1.06) and acquisitions ($7.45). It’s the biggest, most profitable and most competitive market out there. In consequence, its competitive landscape is shaped by app developers from around the world.
Being the first to adopt the new format allowed marketers operating on the American market to optimize their campaigns, achieving high or the highest TTR (2.90%) and CR (14.23%). While there are differences in terms of performance among countries & regions, they aren’t nearly as stark as those between categories. For example, the lowest TTR for Chile (2.39%) isn’t that far behind the USA. The case is similar for CR (10.40% for Mexico). Naturally, those differences are bigger for CPT and CPA, but many economic factors also contribute to these values. Overall, data shows that user needs & mindset are more important than the market that person functions in.
One trend might signal a positive outlook for the placement:
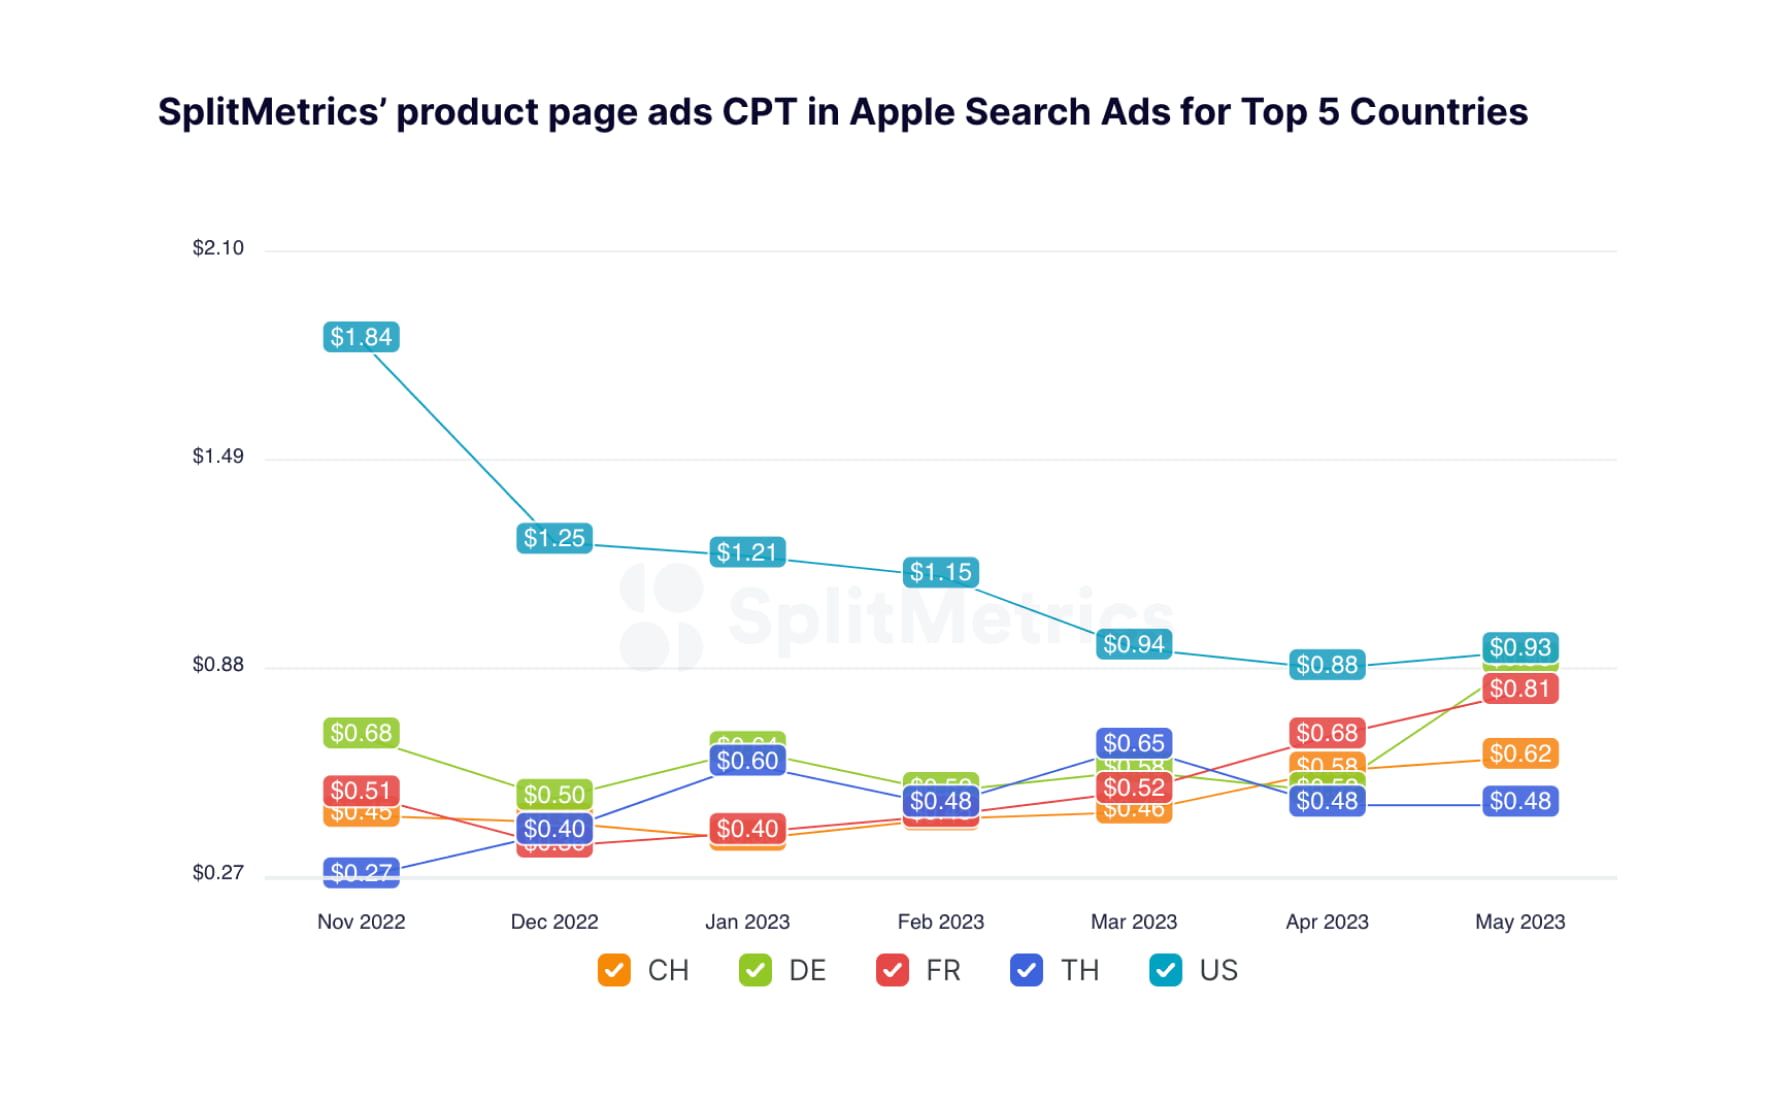
We can observe a sharp decrease in CPA for the US market. Following a period of testing & exploration, it signals the discovery of improved strategies, which bodes well for those adopting the placement later. Other markets might not see this trend yet, but overall we can predict the costs of campaigns to decrease or stabilize overtime, signaling the placements maturity. We should also see improvements in terms of average tap-through and conversion rates.
Product page ads can be an important puzzle piece in your multi-placement campaigns on the App Store.
Even on their own, product page ads have the potential to have good conversion rates and performance metrics promising feasible campaigns. They can snatch users away from your competition: the difficulty of this task is highly dependent on category, but with careful consideration and optimization can be feasible.
However, it’s evident that they are meant to be a supplementary component of a greater whole that is Apple Ads.
For product page ads, it really makes sense to examine benchmarks only related to your app’s category. They represent user journeys and competition level that matters to your app directly. Additionally, adopting product page ads calls for advice on starting multi-placement campaigns in general.
Multi-placement campaigns on the App Store utilize all four available placements to take advantage of the fact that each of them has a positive, synergistic impact on the others.
What is this synergy? Consider the example of Today tab ads: the presence on the front page of the App Store can familiarize users with key visual components of your app and influence the performance of your product page ad campaigns. In our article, A Guide to Search Tab Ads on the App Store in 2023, we’ve discussed that Search tab ads can have this effect too.
Multi-placement campaigns are gaining prominence and emerging success stories show us that taking advantage of all available placements has the biggest potential for app growth:
A case of a multi-placement synergy in Apple Ads:
See how MY.GAMES, the developer of “Rush Royale: Tower Defense TD”, increased impressions, acquisition, and revenue with Apple Ads campaigns across the Today tab, the Search tab, product pages, and search results.
In this context, the most important piece of advice we can give in the context of our benchmarking data is this: observe TTR, CR, CPT and CPA values for your app in general. In this particular case, focusing on granular data will not show you the bigger picture – the result of all placements working together. Think of the entire user’s journey through the App Store and how you plan to touch them on their way to a download.
SplitMetrics has been keeping track of Apple Ads metrics for some time now. To come forward to the growing demand, we’ve expanded our scope over the hears, to include both reports and a live service:
Our benchmarks reports on ads in search results have been an important reference point for app marketers for years now, with the latest covering the second half of 2022.
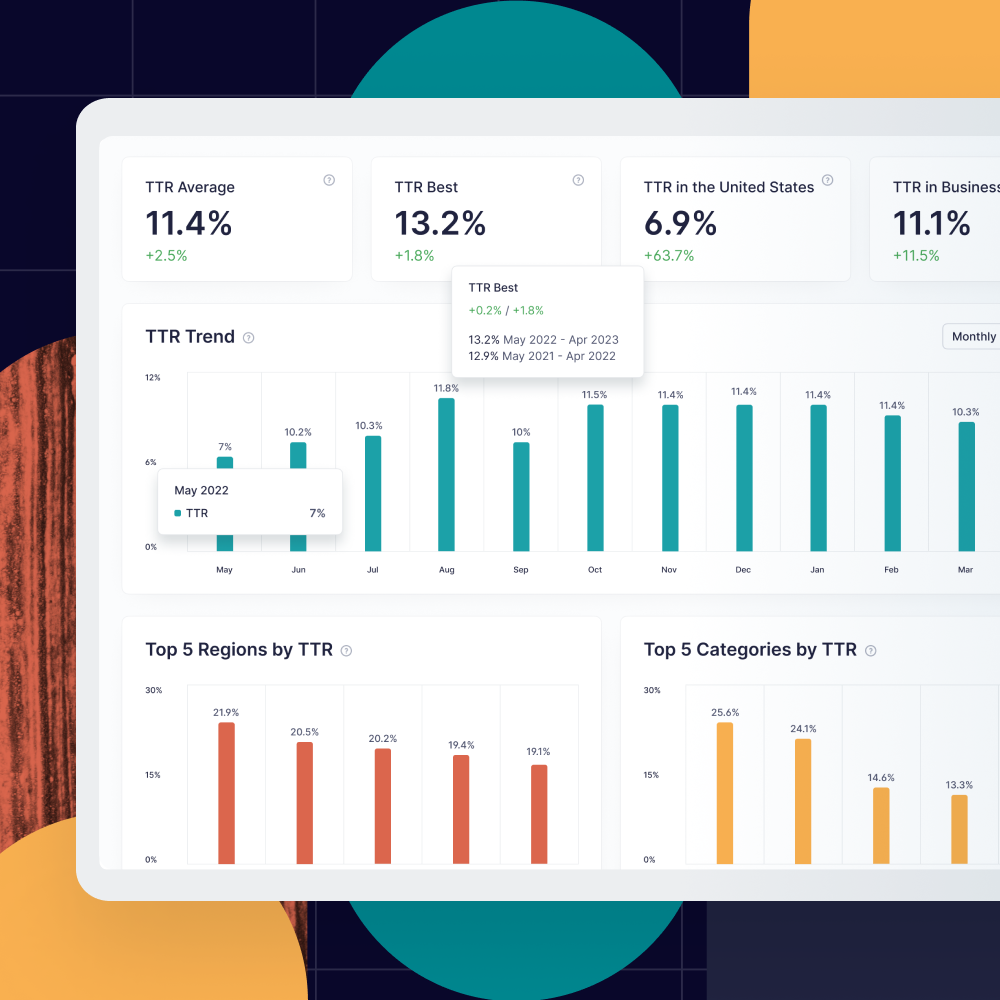
Benchmarks are a key component of day to day work in user acquisition and app marketing. This is why we also share them on our dashboard – updated live.
By covering longer periods of time, our reports help to discern and understand trends in user acquisition costs and user behavior. Most recent benchmarks are an important reference for marketers in establishing realistic campaign goals. Make sure to stay tuned with us, as we’re striving to provide app developers a comprehensive overview of the challenging landscape that is the App Store.