SplitMetrics Update: Advanced Video Analytics for App Preview A/B Tests
 Liza Knotko
Liza Knotko
Liza Knotko 
Video content is conquering the world. According to Hubspot, 90% of users state that product videos facilitate the decision-making process. However, when it comes to app previews in the App Store, one shouldn’t rush to pack their product pages with three 30-second long videos.
There are a lot of cases when a clumsy app preview doomed app’s conversion giving the impression that the publisher doesn’t really care. Nevertheless, smart app previews work their video magic and boost downloads. According to our study, optimization of video previews triggers the average conversion increase of around 16%.
A/B testing is one of the best ways to reduce the risk factor of app previews. To take your video experiments to the next level making them even more impactful, the SplitMetrics team prepared brand new advanced analytics for app previews in the App Store.
Our extended analytics presents a complete picture of how users interact with the app preview on your product page. The advanced metrics are available not only for video experiments but also for all product page A/B tests that feature app previews.
All metrics are represented in the way that smoothes comparison process making it really convenient to:
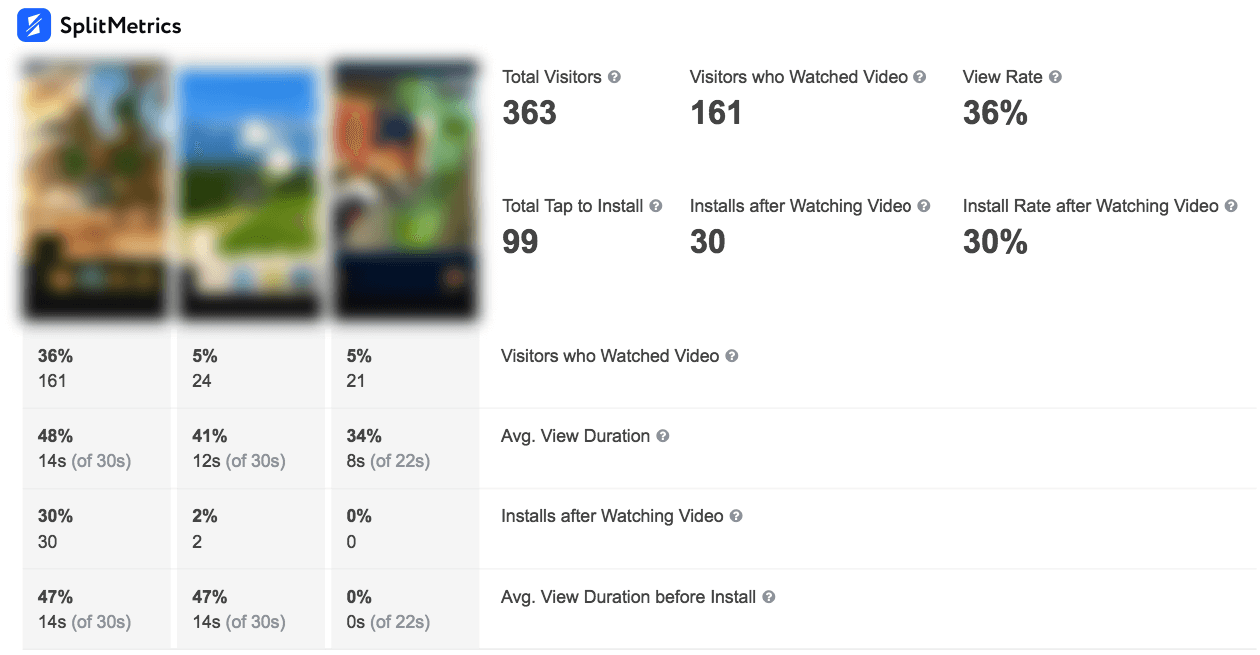
The analytics page now includes the following video metrics:
This metric indicates the number of your product page visitors that watched at least one video on the variation for more than 3 seconds. Mind that time in the autoplay mode is included.
This metric indicates the percentage of visitors that watched at least one video on the variation for more than 3 seconds, it also includes autoplay.
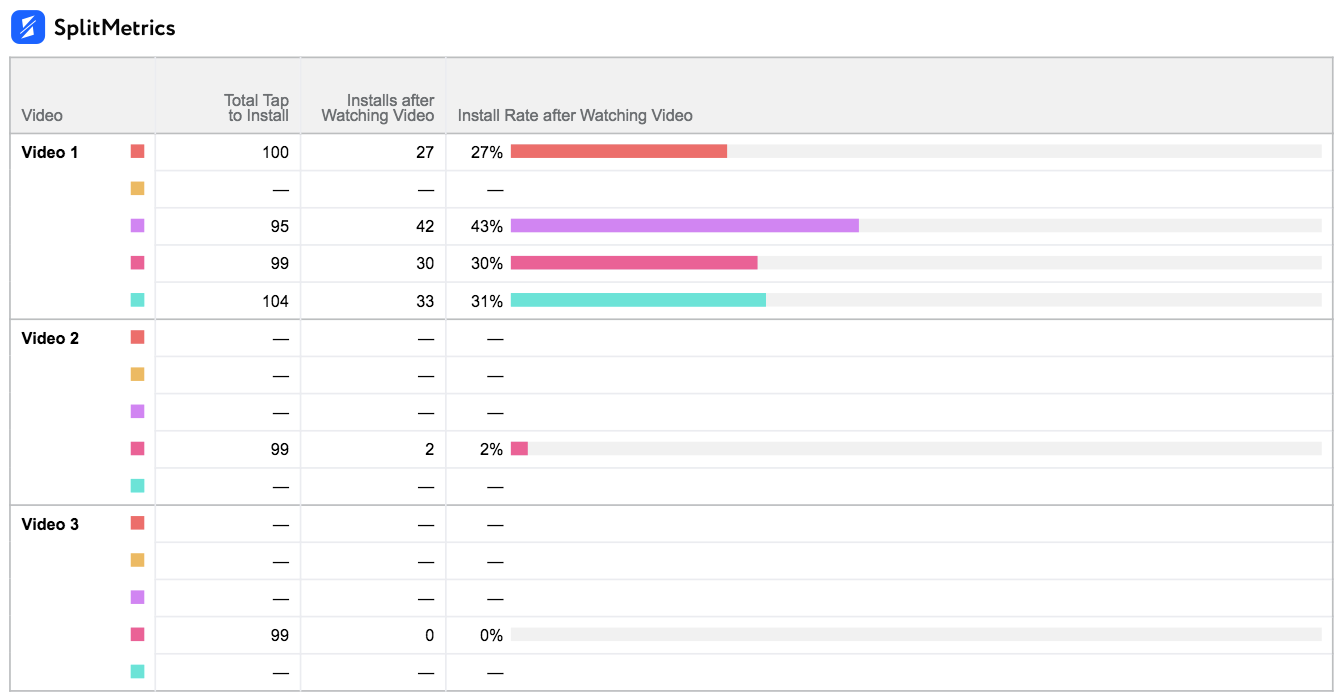
Here you can find the number of taps to install that happen when the video is being watched or after watching more than first 3 seconds of it. Once again, autoplay is included.
This metric shows the percentage of taps to install that happens when the video is being watched or after watching more than first 3 seconds of it (including autoplay).
This metric lets you know the average view duration of your video preview. To make results as precise as possible, we consider only video views that last for more than 3 seconds including autoplay.
Thanks to this metric you can find the average view duration before users tap the ‘Install’ button. For the sake of experiments integrity, we take into consideration only video views that last for more than 3 seconds. The time in the autoplay mode is taken into consideration as well.
The graph depicts the average view duration among visitors of the product page of your app (including autoplay). The coolest thing about this graph is that it is synchronized with the video player. It means that you can find out the very frames of your app preview that make users stop watching your video.
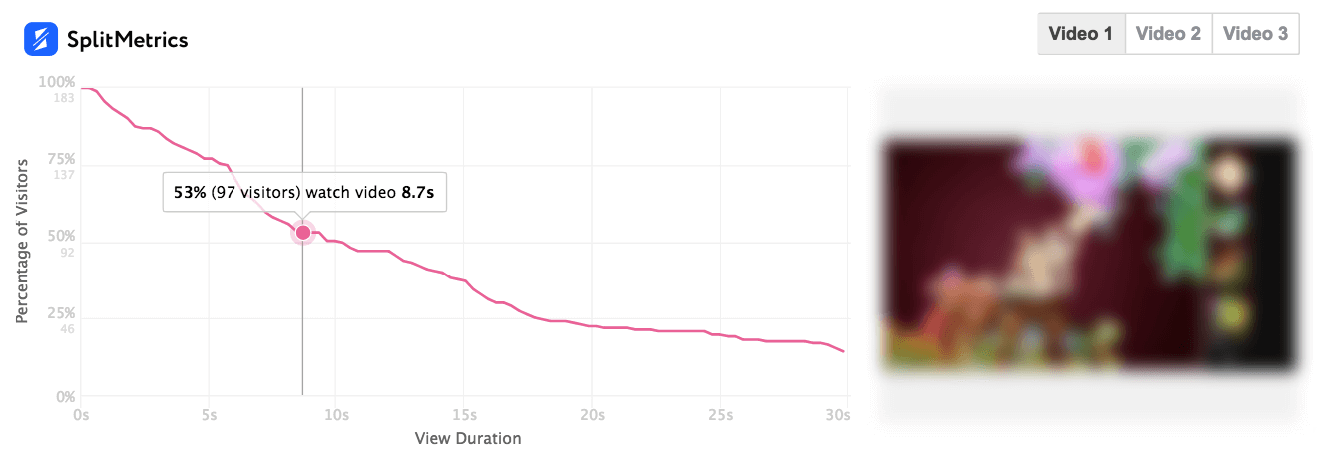
The graph indicates the average view duration before tapping the ‘Install’ button (including autoplay). This graph is synchronized with the video player as well. Thus, now you can identify the episodes of your app preview that triggered installs.
When we started working on extending our video analytics, our main focus was on pains related to app previews that app publishers currently face with. The advanced insights we now provide should turn all these problems into things of the past.
Above all, SplitMetrics video analytics answers the most important question:
Do you need an app preview on your product page?
As it was mentioned above, a poor video may doom app’s performance at times. There are also cases when target audience just prefers a screenshot over an app preview no matter how skillful and awesome the latter is. You can finally find out if your users are interested in app previews at all.
To answer this question you should:
If you confirm the necessity of app previews on your product page, advanced metrics will help to resolve other burning issues such as:
The latest update of SplitMetrics A/B testing platform also assists in nailing a perfect video length as our advanced analytics informs which exact app preview episodes make users leave your product page.
You are also able to identify for how long your app previews can hold users attention. These insights will help you use video time wisely putting the most important content when users are as engaged as possible.
Data-driven approach always makes sense and crafting of app preview is no exception. SplitMetrics provides you with the platform which helps to change your approach to creating videos for the App Store. Now you can find out what your users really need and enjoy conversion increase which will follow for sure.