ASO — 22 Apr 2026
A Guide to ASO KPIs, or How to Measure Your App’s Success
 Gabriel Kuriata
Key performance indicators (KPIs) for app store optimization (ASO) encompass all the metrics critical to understanding whether your strategy is successfully driving more visibility, downloads, and high-quality users for your app.
The evolution of the app stores and changes in user behavior drive the expansion of metrics relevant to ASO. More intelligent ranking algorithms and increasingly elaborate user journeys push the boundaries of what it means to establish a successful presence on any app marketplace, such as the App Store or Google Play.
Consequently, ASO specialists need to examine a broad set of metrics and prioritize them, to not lose focus and implement the right tactics. App success hinges on understanding your data. In this comprehensive guide, we will outline the key ASO KPIs that you should closely track and optimize.
ASO KPIs can be grouped into four main categories that align with the user’s journey in any app store:
Although there are significant differences between the metrics available in App Store Connect (Apple) and Google Play Console (Google), and advanced ASO platforms can offer unique metrics of their own, this classification will fit any strategy, indicating the right direction of data analysis, regardless of tehnicalities or the final list of metrics under the microscope, which should always fit a particular app and its growth strategy.
App store optimization or ASO is done to optimize an app’s organic performance and contribute to the overall growth of your organization. Not only do metrics demonstrate the value of marketing efforts, but they also help you answer crucial questions, such as where to invest your budget and time.
If you know what works and what doesn’t with your ASO, you can make strategic decisions and drive business outcomes with tailored ASO strategies.
Before diving into app metrics and KPIs, it’s essential to understand where your users originate from. As an app marketer, you need to invest your resources into areas with the most significant opportunities for user acquisition.
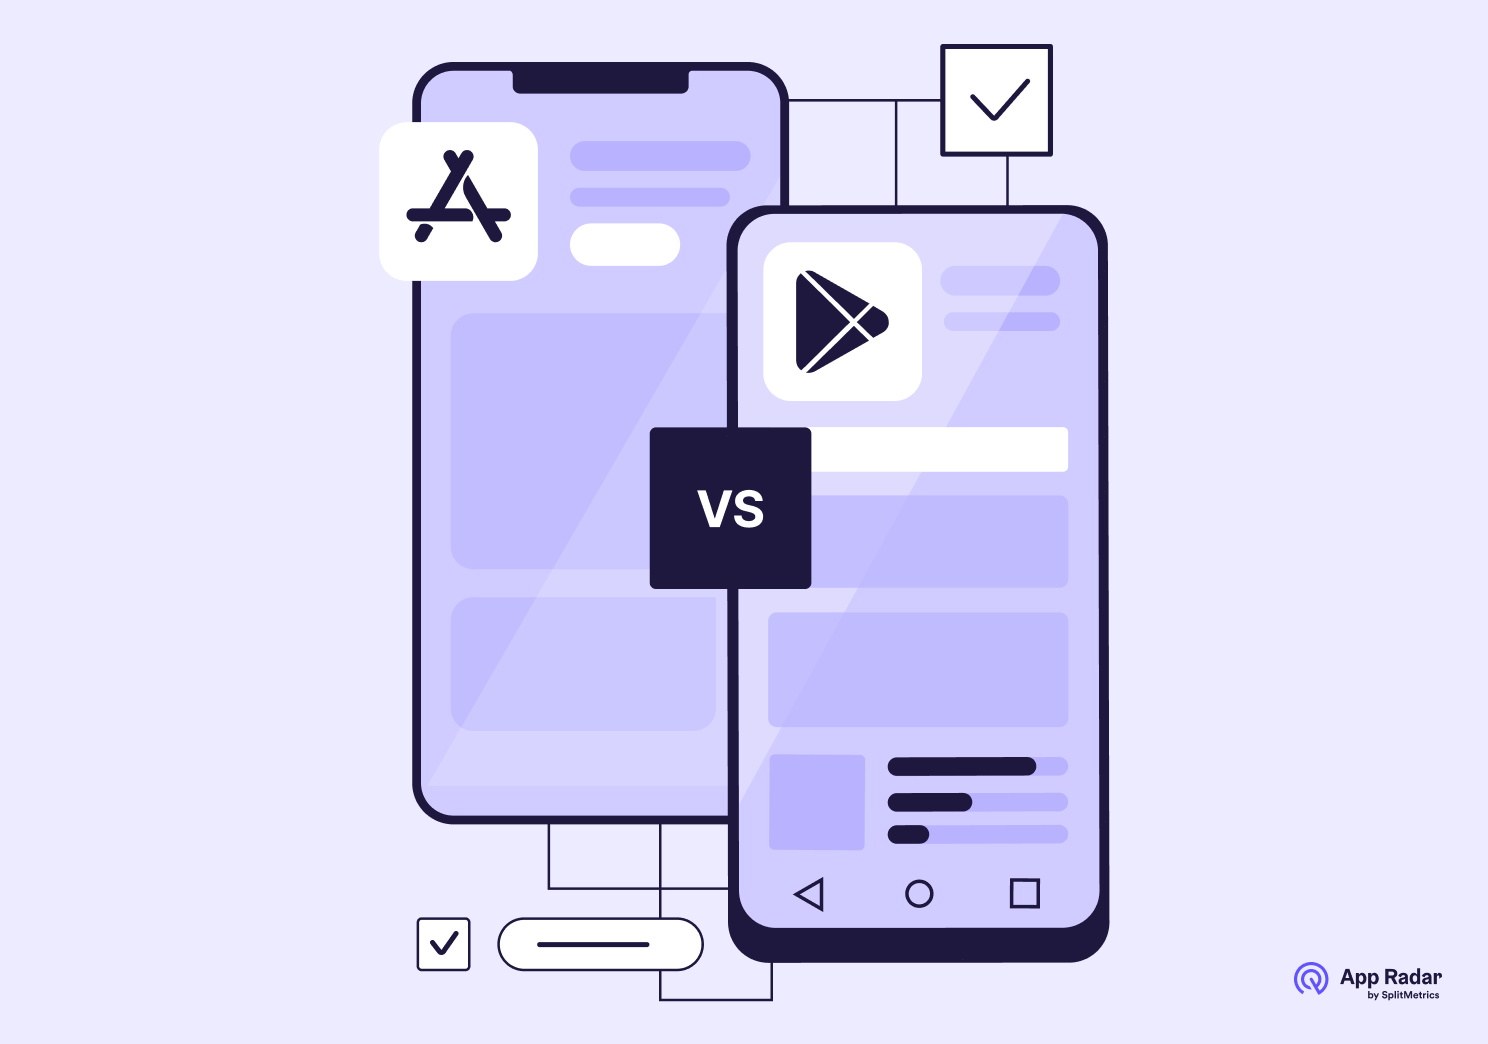
Although there are many app stores, the two largest are the Google Play Store and the App Store. Each of them has different terminology and definitions of traffic sources.
There are three main traffic sources for Android apps in Google Play:
It is important to note that the definitions for all three traffic sources are only applicable to visitors who have not previously installed the app on any device.
Be sure to check the official Google Play documentation periodically. Google Play frequently updates the definitions of traffic sources, so it’s essential to understand which store listing visitors and installs are attributed to which traffic sources.
Apple’s App Store has six categories of traffic sources:
There are some fundamental differences between Google Play and App Store funnels.
Google Play differentiates from Apple’s App Store in a way that you can’t get the data for impressions, that is, you can’t compare all conversion rates directly between the stores.
Apple tracks app views and conversion rates when someone sees your app anywhere in the App Store, while Google shows app views and conversion rates only after the users land on the store listing page.
A typical organic funnel in Google Play looks like this:
Google Play Store listing visitors = the number of users who visited your store listing and didn’t have the app installed on their other devices. Store listing acquisitions in Google Play show the number of users who visited your store listing and installed your app.
A typical organic funnel on the App Store looks like this:
App Store impressions = the number of times your app was viewed in the Search, Today, Games, and Apps tabs. It also includes your product page views. App installs on the App Store are referred to as app units and display the number of first-time app downloads made through the App Store. App updates, downloads from the same Apple ID, and redownloads are not included in the count. However, family sharing downloads are included for free apps.
Apple’s conversion rates indicate the download percentage from the initial app view to the actual download.
Google Play’s conversion rates focus more on how efficiently the app’s assets convince users to download the app. That is why conversion rates are higher in Google Play than on the App Store – because the store listing visitors already show interest in the app by clicking on the icon or app name and are more likely to to download the app.
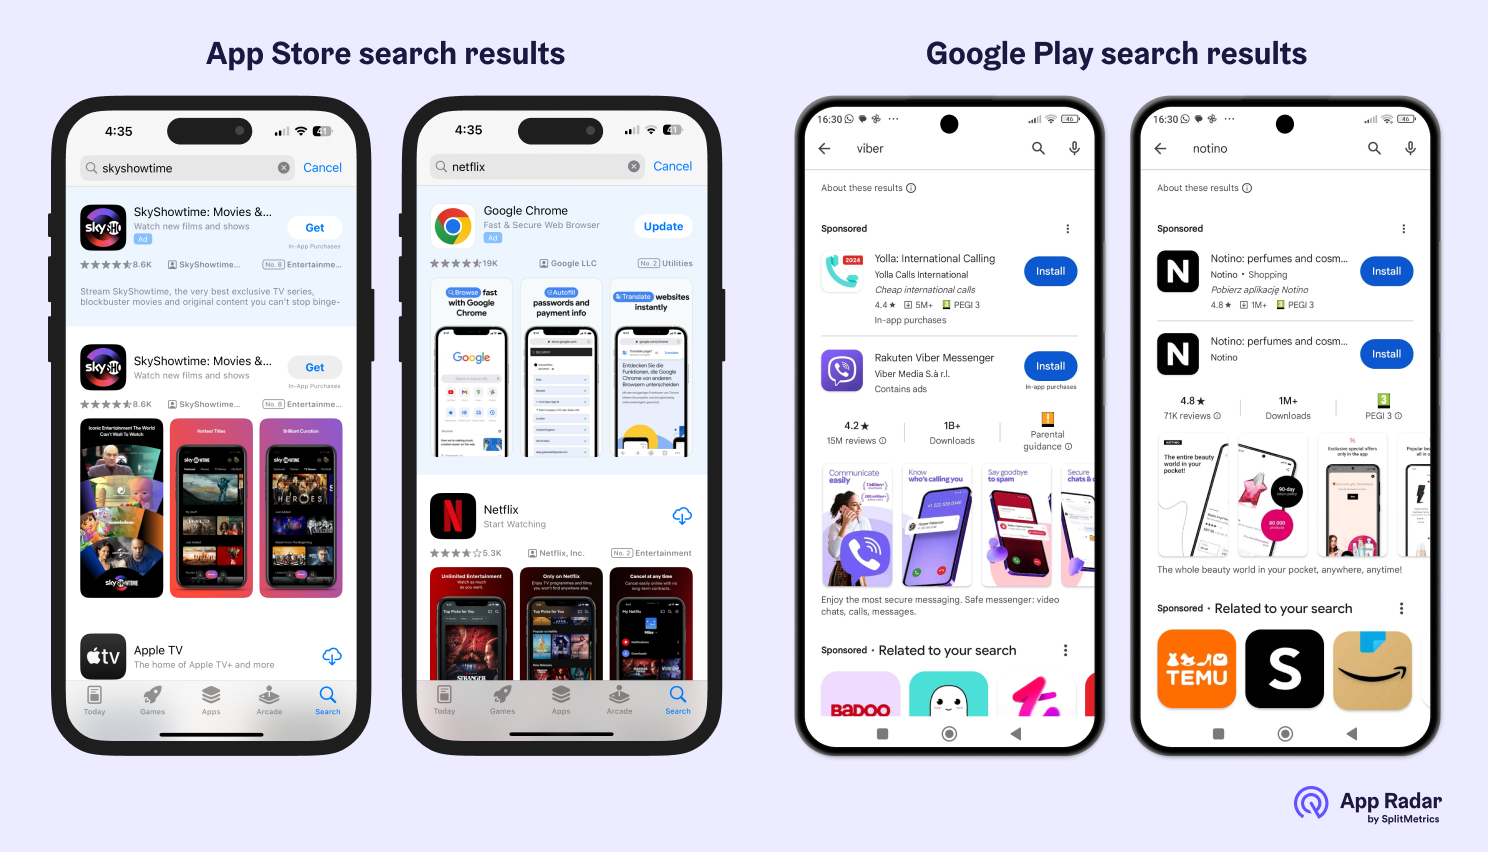
In short, Google Play and the Apple App Store funnels can’t be directly compared. In addition to different metrics, users can install an app directly from the search results in the App Store. On the other hand, Google Play users can’t do that, except when performing brand searches – in that case, the search result will add the “install” button next to the search result.
Once you have a good understanding of the app’s traffic sources, ensure that you understand the definitions app stores use for their own metrics.
In case you are just starting with your app journey, a simple formula for the total installs an app can get is:
Total Installs = Organic Installs + Non-Organic Installs
Organic installs represent users who come to the store listing page without having seen an ad. App store users can find an app via different organic channels. Searching and browsing the app stores are the most common methods of app discovery.
Non-organic installs represent users who discover an app through ads. Typical ads are Apple Ads, Google app campaigns, or ads on any social media network. Whenever people click on the ads, app developers pay a fee to bring users to their store listings.
Apple doesn’t separate organic downloads from non-organic downloads – paid search ads downloads are mixed with organic search downloads in App Store Connect. On the other hand, Google Ads downloads are listed as third-party referrers in the Google Play Console; however, other ads and user sources also contribute to the complexity of the analysis, including social media ads and web referrers.
The second crucial thing to understand is the difference between app downloads and installs:
App download = user downloads an app on a device.
App installs = A user launches an app for the first time after downloading it and it is recognized as the installation
Ensure you understand the definitions accurately, as your KPIs will be incorrect if you misinterpret them.
Apple, Google, and mobile measurement partners (MMPs), such as AppsFlyer or Adjust, use different terms for downloads and installs and interpret them differently. The App Store’s analytics make this even more confusing by referring to downloads as “Installs,” which is the sum of “New downloads” and “Redownloads.”
It can be pretty challenging for app marketers to understand what is actually measured by each metric. To start, remember that an app download is counted when a user downloads an app on a device, even if the user doesn’t open it on the phone or tablet. App download is a signal that a user is interested in using the app.
An app install is counted only when the user launches the app, because it indicates that the user is exploring the app’s features.
Most of the time, the number of downloads doesn’t match the number of installs. This is because some users do not open the app after downloading it.
For example, a user might accidentally click on the “GET” button (on the App Store) or “INSTALL” button (in Google Play) before realizing later they have downloaded the wrong app, which they simply uninstall and never open.
According to AppsFlyer, this issue affects approximately 20% of users, resulting in data discrepancies between developer consoles and MMPs.
The App Store and Google Play consoles name downloads differently from one another. The definitions are also slightly different but they mean more or less the same thing: download. Specifically, the App Store refers to first-time downloads while Google Play counts downloads when the user hasn’t yet installed the app on any devices.
ASO improvements often increase performance in non-organic traffic and related KPIs. All users will eventually arrive on the App Store or Google Play to download an app, so optimizing the store listing will have a certain impact on conversion, even if the users come from paid campaigns such as Facebook or Google Ads.
There is no shortage of app metrics to track. As an app marketer, one of your tasks should be to define the metrics that matter for your app and that are tightly connected to your business.
While every app has its specific aspects, there is a good number of metrics and KPIs that every app owner should track. These metrics include:
Let’s have a look at each group and provide more detail about their metrics.
Store visibility metrics encompass all factors that directly impact an app’s visibility in app stores. Or, to put it differently, increasing visibility in app stores means increasing an app’s reach within the stores.
A positive visibility impact could be, for instance, that your app ranks for more keywords than before and that it captures top 5 ranking positions for popular and relevant app keywords.
The reason we work on app store optimization is to maximize the chances that a user will discover our app in various places. We want our app to be visible in the search results, on the store homepage, or listed under different recommended sections.
If we perform a specific ASO activity to increase an app’s visibility, we should expect an increase in impressions or store listing visitors if the optimization is successful. We can and should also monitor the acquisition source and traffic source breakdowns to understand which channels contribute the most to the increase in visibility.
For instance, App Store “Browse Impressions” will jump if the app gets featured. App Store “Search Impressions” will increase if the app keyword optimization is done correctly.
A common and important store visibility metrics are:
We can quickly define what these metrics mean.
App Store Impressions on the App Store refer to the “number of times an app is viewed on the Today, Games, Apps, and Search tabs”, as well as on its own product page. Apple registers an impression only if an app is viewed for more than one second to make this metric reliable.
This metric can’t be found in Google Play, and only the App Store tracks impressions.
Store listing visitors are users who visit an app’s store listing on the Google Play Store without having the app installed on other devices.
Apple defines App Store Product Page views as the number of times an iOS user views your app’s product page in the App Store.
Both of these definitions are very similar for each app store.
App keyword rankings are the positions an app holds in search results for a specific keyword or phrase in app stores. The rankings are important because they positively correlate with app visibility and the number of organic downloads an app can get.
Higher rankings for relevant keywords result in increased traffic to the app’s product page and a higher potential for installs.
Top charts in app stores are lists of the most popular apps in a particular category or overall, ranked by download numbers, user ratings, and other relevant factors.
They are important because they demonstrate how apps perform in comparison to their competitors.
The top charts also serve as a discovery tool for users, helping them find new and popular apps in their respective categories. A high ranking on the top charts often results with more downloads attributed to the Explore or Browse sections.
The higher an app ranks in its respective category, the more visible it becomes to potential users and the greater its chances are of being featured and attracting additional app downloads.
Similar apps are those that target the same audience as your app. They matter for app visibility because they help users discover and compare similar apps.
When a user browses an app store, they may come across an app they like and then look at the “similar apps” section to find other options that suit their needs.
Being listed as a similar app to a popular app in the same category can add an extra layer of visibility and potentially increase downloads.
App featurings refer to apps promoted by the app stores, such as being featured on the homepage or in a curated list.
The results of an app being featured are reflected in spikes in Browse impressions (App Store) or Explore store listing visitors (Google Play). If the app featuring was effective, the downloads will go up as well together with a drop in Browse and Explore conversion rate and total conversion rate. This is because many people will see the featuring, but not many of them have the intent to download your app.
As an app marketer, you want to track where and when your app gets featured better to understand its impact and contribution to your overall traffic.
App ratings and reviews are feedback left by users on an app’s listing page in app stores. They serve as social proof and influence potential users’ decisions to download or not.
Higher ratings and positive reviews indicate that an app has high quality, it is reliable and valuable, which increases the likelihood of downloads.
Additionally, app stores use ratings and reviews as a ranking factor – apps with higher ratings and more positive reviews are more likely to appear in top results.
Android vitals are Google Play metrics that help developers identify and fix issues that affect the stability and performance of their apps. Android vitals monitors various aspects of an app’s performance, including battery consumption, app crashes, and ANR (App Not Responding) rates.
Android vitals impact app visibility because they affect the user experience. While you can’t see Android vitals somewhere in Google Play, you should track them in Google Play Console because they can harm app’s visibility and reputation.
App conversion rate refers to the percentage of users who perform some kind of action in app stores that is tied to your app store goals. Those actions can be views, clicks, downloads or whatever is important for your app.
App conversion rates indicate the effectiveness of the app store listing in attracting potential users. For example, a high download conversion rate means that a larger percentage of users who view the app listing ultimately download the app.
Conversely, a low conversion rate may indicate that the app listing needs improvement in terms of its icon, screenshots, description, or other elements. For example, your app screenshots should provide enough information about your app and if possible, directly address user intent.
As app marketers, we want to monitor app conversion metrics and KPIs to enhance the store listing and increase the likelihood that a user will download the app.
Many app marketers try to compare these main conversion rates for many reasons, such as evaluation of marketing activities, reporting purposes, etc. However, the majority of users on the App Store download the app directly from the search results – every app that appears in the search results can be installed without visiting the store listing page first.
Conversion rate varies by traffic source depending on user intent. The conversion rate from Search is generally higher than Explore or Browse conversion rates – users who come from Search have a higher intent to download an app from the presented results (this is even more emphasized for brand names).
The conversion rate of web referrers, app referrers, and third-party referrals is influenced by performance, paid marketing strategies, and organic traffic from the website. To monitor conversion rates systematically, always examine the traffic sources and their corresponding conversion rates to gain a comprehensive view of overall performance.
While not all conversion rate metrics might be necessary for your business (especially if you focus on organic or paid acquisition only), we still recommend paying attention to the following metrics.
Let’s have a quick look at those metrics as well.
The store listing conversion rate in Google Play indicates the percentage of people who visited your store listing page and subsequently downloaded your app.
Google Play Store listing conversion rate = the percentage of store listing visitors who installed your app. Ensure that you measure the conversion rate per source level: Search, Explore, and Third-party Referrers.
The improvements you make to your store listing should increase the chance that each visitor (measured by store listing visitors in the Google Play console) decides to install your app.
Inside the Google Play Console, you can access the conversion rate of your app compared to peers, which helps determine how your app’s performance compares to the competition.
This data is helpful because it allows you to compare your app with the competition. Also, if your competitors receive many keyword rankings and have high conversion rates, you will be able to estimate better if increasing conversion rates pays off or not.
Shifts in store listing visitors can also cause changes to your conversion rate, even if you don’t work on the conversion optimization. If keyword rankings change because of competition changes, algorithm updates, or seasonality, your conversion might change, even if your store listing didn’t change.
The impression of App Store units is the most general type of conversion rate that is easy to understand.
Impression to App Store units = number of app units divided by number the total unique device impressions
The average conversion rate on the App Store differs from that on Google Play. The main reason lies in the fact that Apple shows app impressions – when users see the app icon somewhere in the store.
Google Play doesn’t display app impressions in search results or when your app icon is viewed elsewhere in the store. The only impression that counts is when a user arrives on the store listing page.
As a result, conversion rates on Google Play are much higher because user search intent is stronger – when someone navigates to the store listing page by clicking on your app icon, the intent is already strong enough, and the conversion probability is higher.
App installs are the most obvious and typical metric for measuring the impact of visibility improvements. However, app installs are also a crucial KPI for measuring the success of your conversion rate optimization efforts.
The ultimate goal of ASO should always be to achieve a higher install volume. If you improve your conversion rates, the number of installs you receive will increase. This will be closely connected to better keyword rankings – your app will receive better rankings in search results, convert more visitors into users, and again be rewarded with more positive organic placements.
This top-of-funnel metric helps you understand the ability of your app preview screenshots or video in encouraging store visitors to take a deeper look. This helps to determine how well app preview attracts users deeper into your product page.
Nevertheless, a product page view does not always result in an install, but it is still valuable to track this KPI to understand how efficient your app’s funnel is.
This fundamental ratio is a KPI for measuring conversion rate performance from the unique viewer to install conversion rate on the App Store. Making improvements to your metadata and creatives is ultimately done with the goal of increasing the chance that each person in Search and Browse decides to install your app.
Similar to Google Play, ensure that you measure the conversion rate at the source level. Search and Browse are the primary factors for tracking organic progress, but you can also include referrer channels to get a comprehensive picture.
To measure changes that only affect your product page on the App Store, you must measure the product page view-to-download conversion rate. Elements that affect your product page view conversion rate include promotional text, description, screenshots, and video.
Additionally, your product page features other elements, including ‘What’s New’, app information, a header image on your app’s product page, and promoted in-app purchases.
Don’t forget that paid campaigns send users to your product page as well and can skew this conversion rate.
Apps can have a higher number of downloads than product page views in the App Store, since users can directly install your app from search results. That is why we recommended focusing more on the impressions to download conversion rate than this one.
This ratio shows the number of new app downloads from your product page.
Selecting “first-time downloads” rather than “installs” in App Store Connect excludes re-installs from users who had already downloaded your app. We suggest using this ratio to measure the conversion of referral and paid advertising campaigns that directly lead to your app’s product page.
App Store users can download apps straight from search results without having to ever open the app’s product page, which means this ratio can be greater than 100% if your installs originate mainly directly from the search results.
This is the most commonly referred to ratio when discussing “conversion rate” in the App Store. It measures any downloads coming from new users.
For instance, if a user sees the app in search results and then lands on the product page, only one impression will be counted for that user if you select “impressions (unique devices)”.
This ratio is probably the most important conversion rate to focus on – it considers only organic traffic sources. It doesn’t look at changes in paid UA strategy or impressions that come from app featurings.
While it is great that your app has more visibility across the app stores, gets more installs, and has high conversion rates, your business metrics need to grow as well.
Your app business will most likely focus on a dozen different metrics and KPIs. The ones that we see as the most important ones are:
We won’t go into detail about those, but we highly recommend that you pick general app metrics next to ASO ones.
Beyond traditional ASO factors, the app stores now use your app’s technical quality as a direct ranking signal. Metrics like Android Vitals (crash rate, ANR rate, and excessive battery usage) and similar performance indicators for iOS are crucial. A high-quality, stable app with strong user engagement is rewarded with higher visibility. By monitoring metrics such as user retention and DAU/MAU ratios, you signal to the app stores that your app provides a valuable user experience. Therefore, a modern ASO strategy requires a holistic approach that connects your app’s technical performance with its marketing efforts.
ASO metrics can be complex; therefore, it is essential to approach them with caution. It is easy to make some conclusions when correlations appear, but we suggest paying additional attention to the following situations:
Keep the big picture in mind and check how your entire KPIs and acquisition channels move together with your marketing campaigns.
There is no single indicator that can measure the overall success. Apps have different goals, and your KPIs and metrics should be in place to help you track your progress toward these goals.
Our most important recommendation is to maintain a holistic view of all the metrics mentioned in the article. This means combining them together and watching their progress to get a complete picture of your app’s performance.