A/B Testing — 2 Apr 2020
Vezet Case Study: Increased Click-to-Install Conversion Rate
 Lina Danilchik
Lina Danilchik
Lina Danilchik

SplitMetrics client, Vezet, shares how they managed to improve Click-to-Install conversion rate for their Vezet ridesharing app with the help of app store A/B testing.
My name is Andrey and I am responsible for contextual advertising and ASO at Vezet. We provide on-demand ridesharing services in more than 120 cities of Russia. I’ve learned a lot about conversion rate optimization, and now I’d like to share my experience with you.
App Store Optimization is one of the most useful and cost-effective tools for increasing the number of app installs. And optimizing click-to-install (CTI) conversion rate is one of the main ASO aspects.
Why is working on CTI conversion rate so important? Let me explain with an example: let’s say your app has 10,000 installs per day, and you decided to change an icon. Then you saw a 3% increase in CTI rate. You may say that 3% is a small figure. But, in fact, it means 300 extra installs per day or 9,000 installs per month. And that is done by updating just one of your app store product page elements! Imagine that the ARPU365 (average revenue per user in 365 days) of your product is $100 and the install to client conversion rate is 10%. Then you get 900 clients x $100 = $ 90,000 of extra revenue next year. And that is done solely through CTI conversion rate optimization!
We conducted endless experiments to understand how exactly a particular app store page element would affect the CTI. We used Google Play Console for experimenting with our Android app and we used SplitMetrics for experimenting with our iOS app. SplitMetrics allows you to test different elements on a stand-alone web page that emulates a real App Store page.
Unlike Google Play, the App Store doesn’t let you test changes on organic traffic, but you can put a link from SplitMetrics to a smart banner on the site (which pops up at the top of the web page). We use Google Ads (Display Network) and Facebook Ads to promote our test page. We chose these advertising channels because they work with custom links well. The experiment ends when its results have statistical significance. You will understand that if you look at data in the platform or if you analyze your test data.
The testing system expects to get the right amount of data and distribute it significantly among all the options. But sometimes you have to wait extremely long for it to happen. This can become critical if you spend money on test traffic, or if one of the options is clearly worse, but the system does not see it yet, and you lose users in the meantime. In this case, it makes sense to look at the current data and decide to stop the experiment, choosing the most effective option. You also don’t have to wait for the end of the test in case of using seasonal creatives. In this case, the creative is temporary and is later replaced with the original version. But it should in any case work better than the original version.
By the way, SplitMetrics is able to redistribute traffic using the multi-armed bandit routing method: more traffic goes in favor of the winning option, helping to increase its significance for completing the experiment.
If you use a Google Play Console toolkit, you can test:
In SplitMetrics for Google Play, you can also test titles, prices, ratings, and reviews. SplitMetrics service for App Store lets you test everything you want almost everything:
You can test a single element in several variations or multiple elements at once (multivariate testing). Keep in mind that the more options you test, the more traffic you will need, and therefore the test itself will take longer.
The distribution of elements by frequency of testing is prompted by the effect of each element on the CPI. We tested the following elements (in descending order of test frequency):
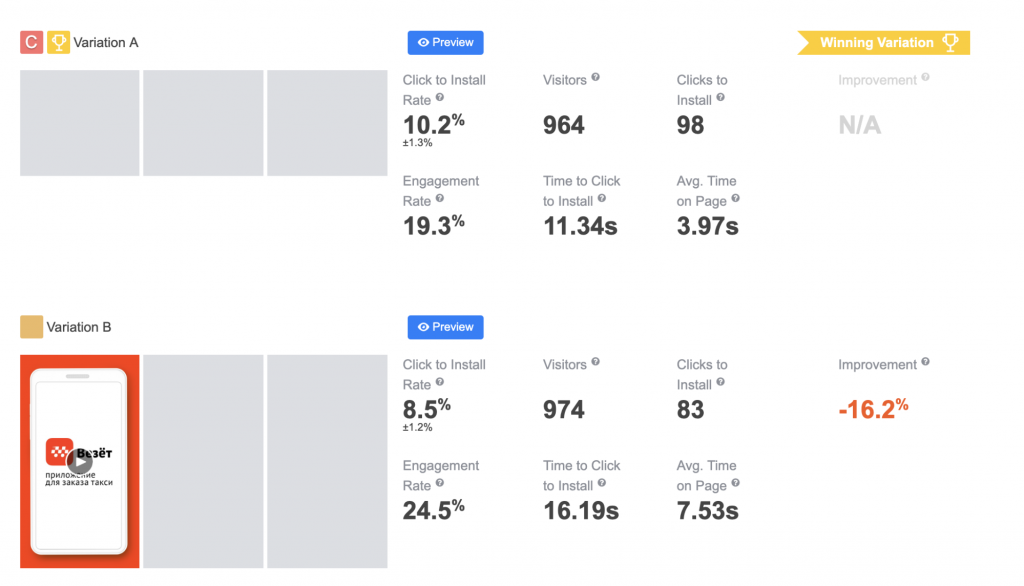
For the first experiment, we decided to use different ad slogans and different styles of images. In subsequent experiments, we tested different combinations of slogans and visuals.
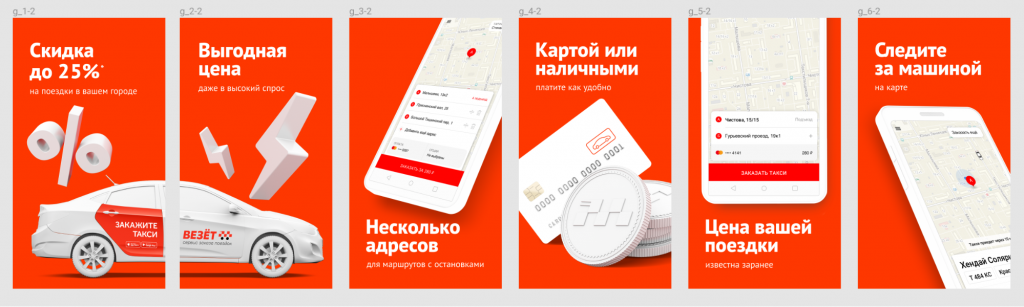
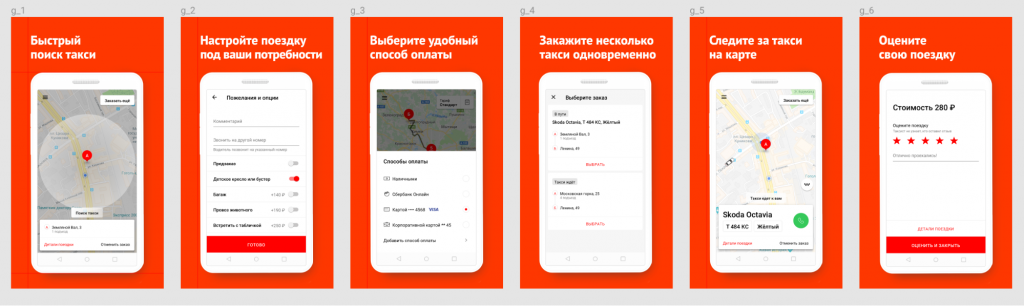
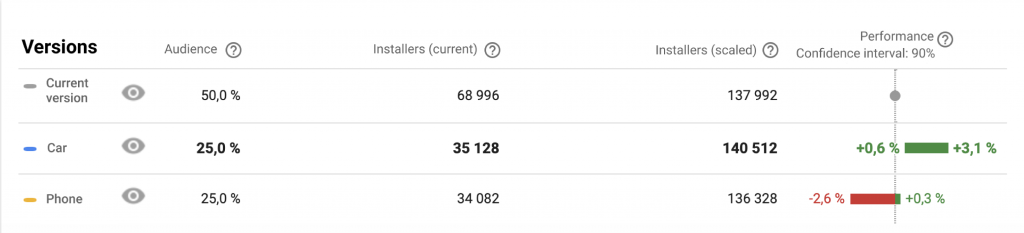
We saw that the screenshots with a car were significantly more effective than the standard ones, with a phone. As a result, we started to permanently use these visuals, and our CTI rate grew by almost 3%.
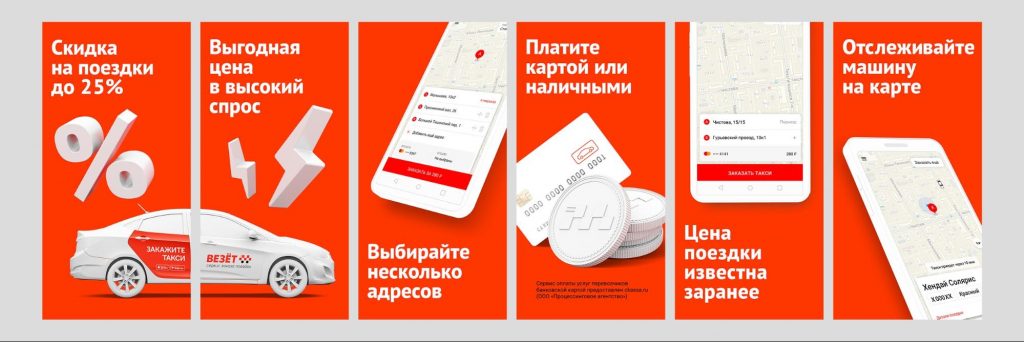
We conducted other tests with screenshots. But their results were also worse than the first winner’s ones. Even the version with the enlarged text lost to it, despite the better readability of the text:
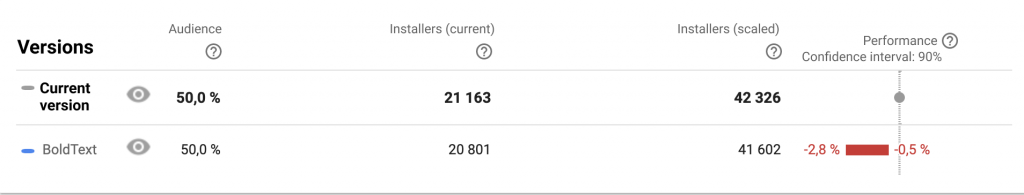
Experiment results
As for the iOS devices, the experiment took several iterations, since the result was not obvious. The initial test was conducted with similar options as in Google Play Console, and the test version with a car also won.

But the difference was too small compared to Google Play Console, so we decided to conduct another set of experiments. We compared our standard visuals with the same ones, but with the only modification: all font sizes were enlarged. And the last test variation won (unlike on Google Play).
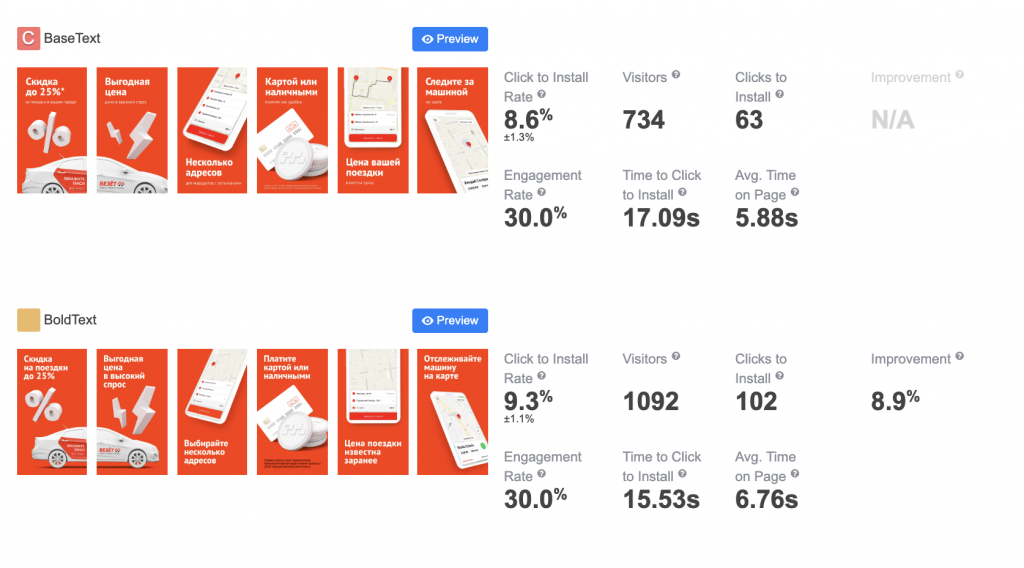
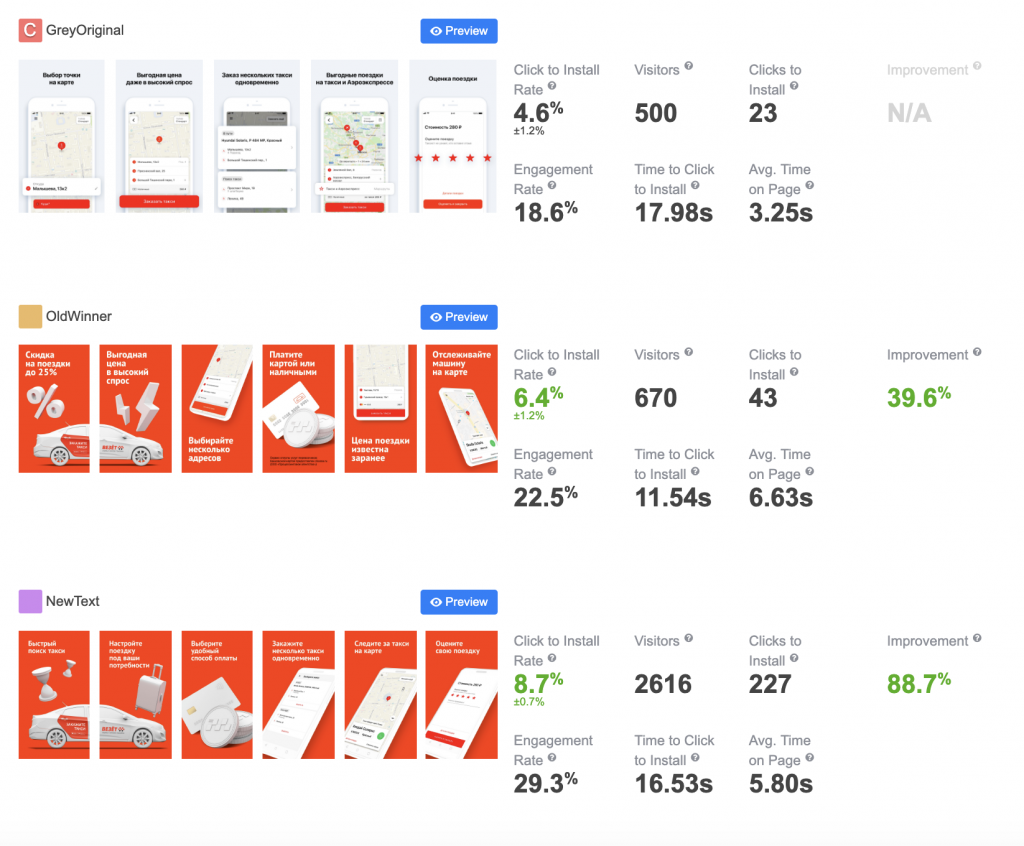
Then we started to test combinations of previously tested variants. We took the usability slogans from the first test and added them to the visuals of the current winner. The new version won. CTI rate was higher by 2.7% compared to the previous winner and higher by 4.1% compared to the current version.
The second most important element is an app icon. The image of the car on a red background did not perform well, despite the fact that it can often be seen in our ads and should have become quite recognizable. We decided to try a simple version of the app icon with a text logo, and it worked.
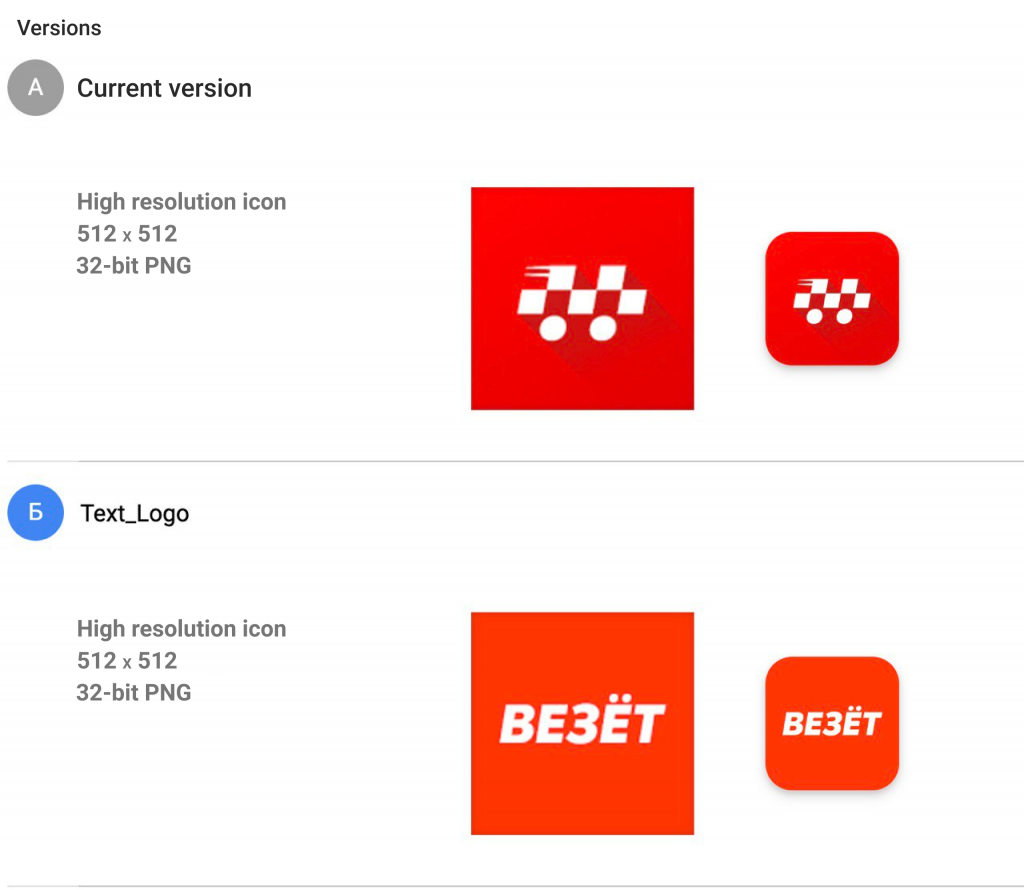
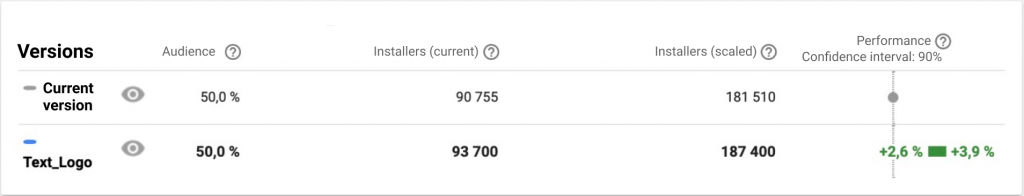
The text icon was significantly more effective than the current logo, with an average CTI increase of 3.3%.
We tested 7 more variants of icons with different elements, but none of them was able to beat the current winner.
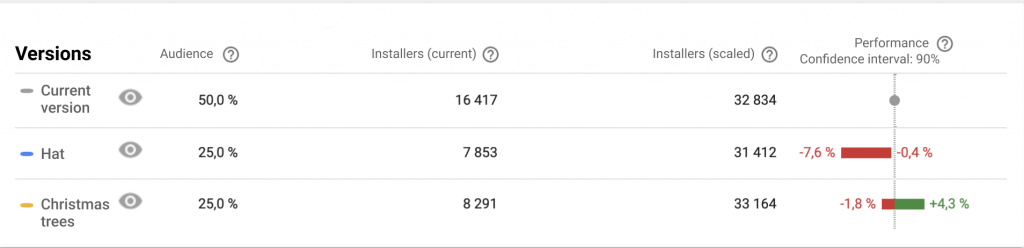
A few weeks before New Year’s Eve, we tried holiday-themed icons in Google Play:
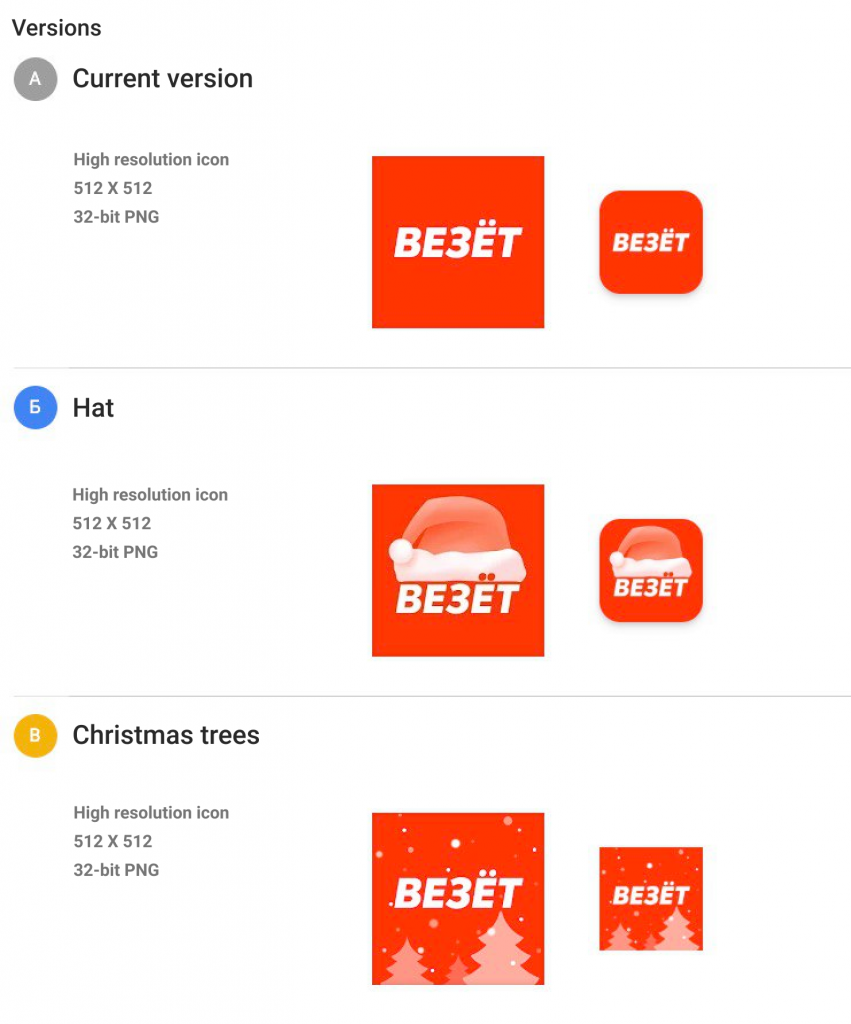
The system could not decide on the winner for a long time, but right on the eve of the holiday, a clear favorite began to appear. It was the app icon with Christmas trees.
We looked at how our competitors were doing with videos but found nothing interesting. So, we needed to test videos and make decisions based on app store A/B testing experiments. We first developed a simple screencast that demonstrated the advantages of our app. It had a neutral or even negative (according to the SplitMetrics platform) effect on CTI rate.
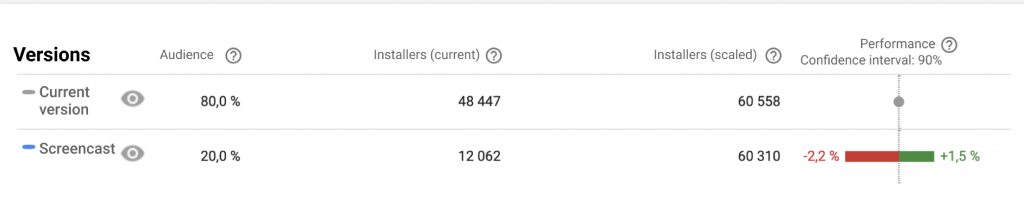
Later, we tried again to use the videos with the “animated screenshots” concept (first two screenshots were animated). We also shortened the length of the videos from 15 to 5 seconds and made other versions with and without CTA.
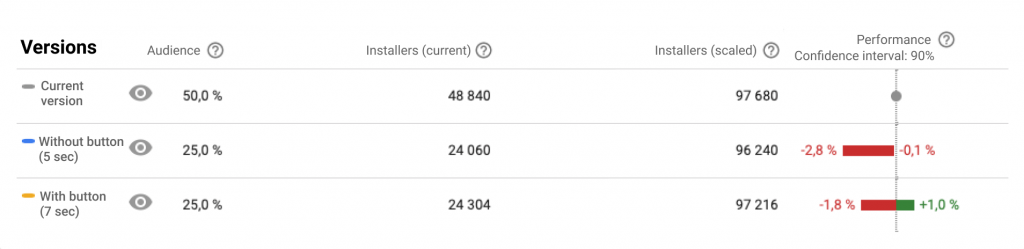
Google Play test results
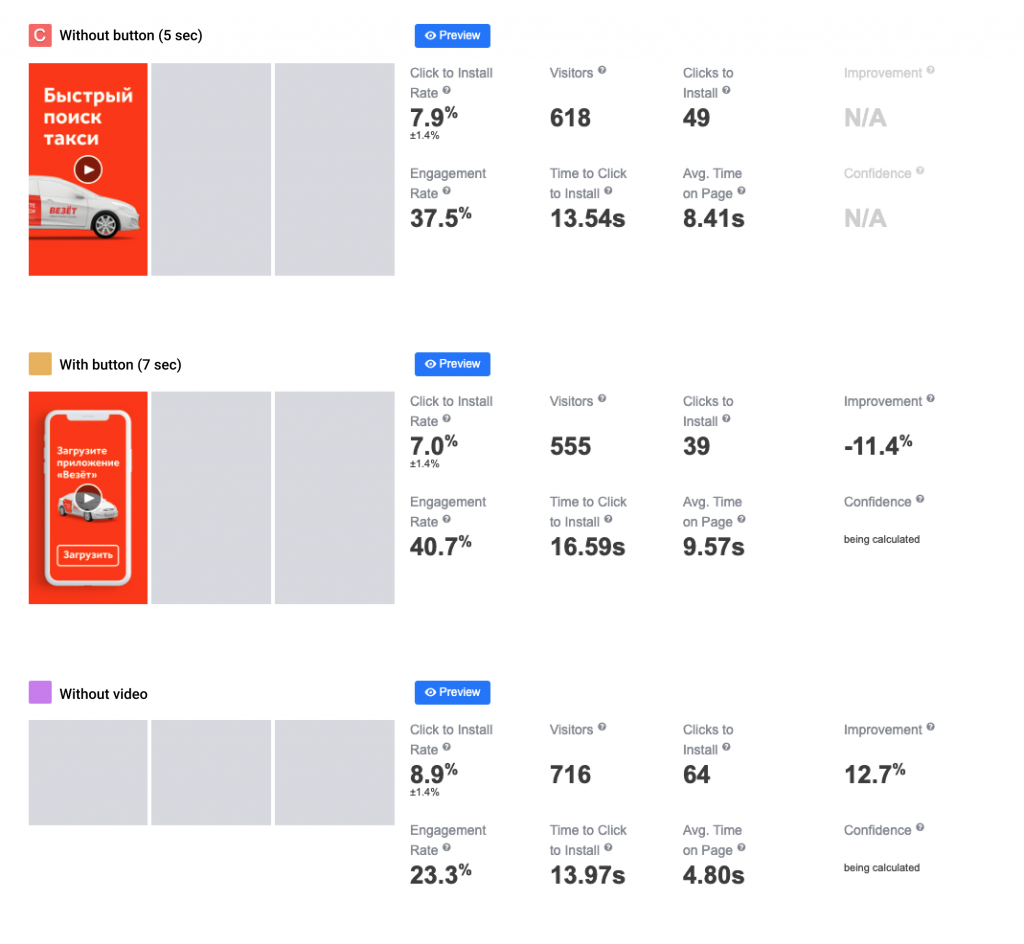
Video is definitely not necessary for us.
Editor’s note: videos are not always good for conversion. See tip #5.
We noticed that many of our colleagues started to switch to landscape screenshots in the app stores. We developed landscape screenshots with the same content as the portrait screenshots we were using. And here is what experiments showed.
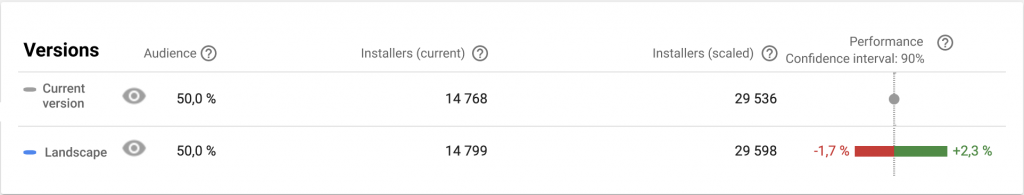
Google Play test results
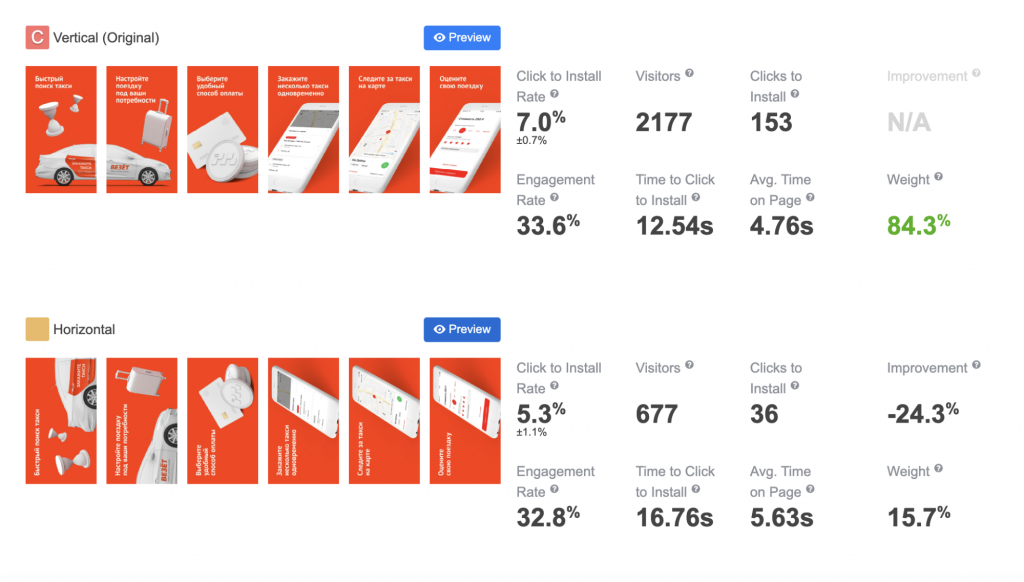
Our landscape screenshots performed either similar to the current ones (in Google Play), or even worse (in the App Store).
We once had problems with the rating in app stores, so we decided to test if we can improve CTI rates with different ratings. We used SplitMetrics for that, even for the Android app, since rating experiments are not available on Google Play Console.
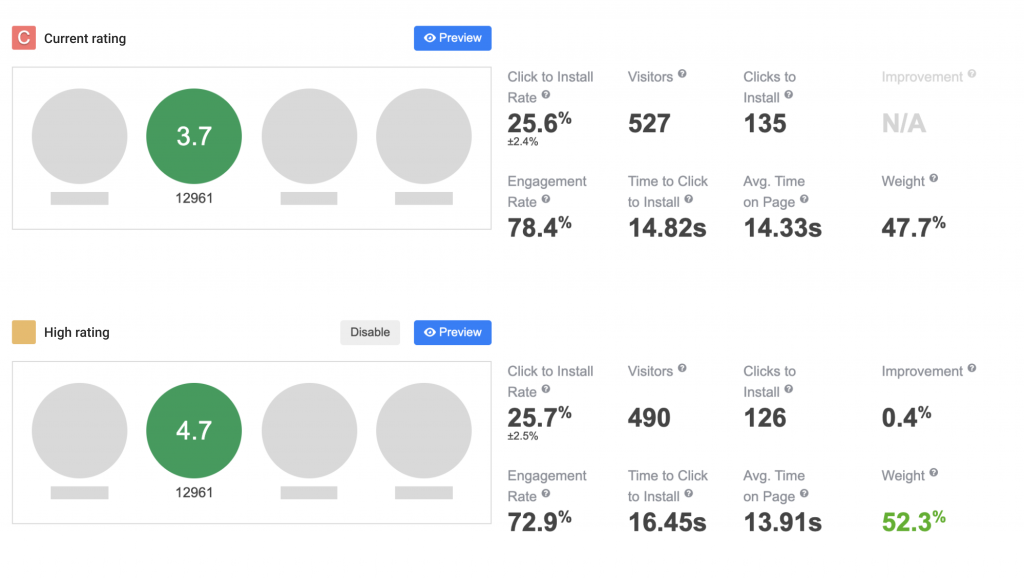
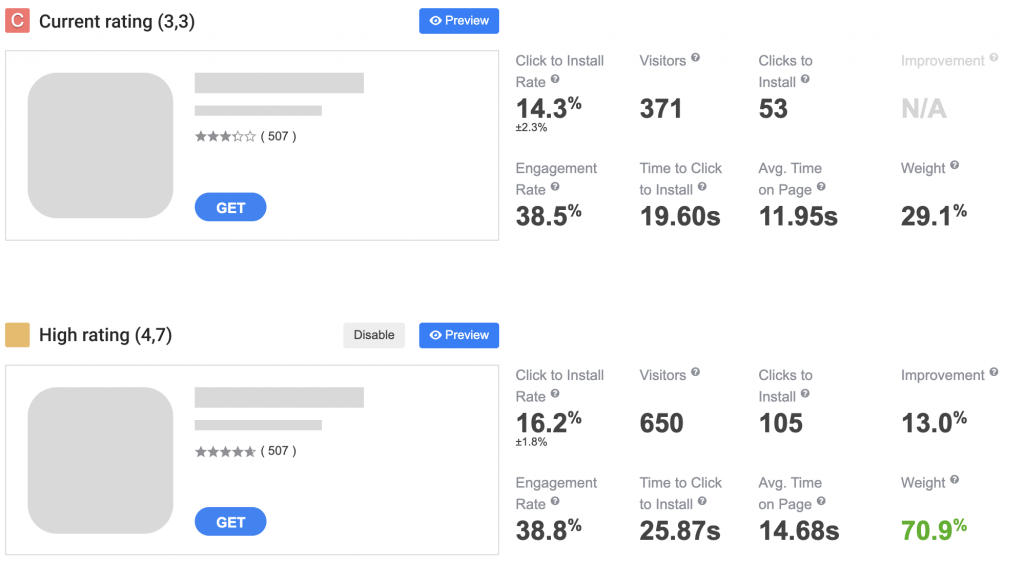
So, Apple users are more sensitive to app ratings. Well, we are constantly working on improving the service quality and app’s performance.