ASO — 4 Apr 2016
App Conversion Rate: 10 Ways to Increase It with Page Analytics
 Alexandra Lamachenka
Alexandra Lamachenka
Alexandra Lamachenka 
What happens when people come to the store page of your mobile app? Specifically, what are visitors doing from the moment they arrive via a marketing campaign link to the moment they drop off or hit the “Install” button?
Knowing how visitors move through your app store page and interact with its content helps you optimize it to increase the conversion rate of your mobile app.
We launched advanced visitor behavior analytics for mobile AB testing which facilitates the increase of mobile app conversion rate. In this article, I’ll share how mobile app publishers and marketers have been using SplitMetrics features to run better a/b tests for their mobile apps, increase app product page conversion rate, improve their app store visual assets, and optimize marketing activities.
Note: the first free experiment comes with all the advanced mobile app store page analytics features and profound conversion rate statistics. Sign up and try.
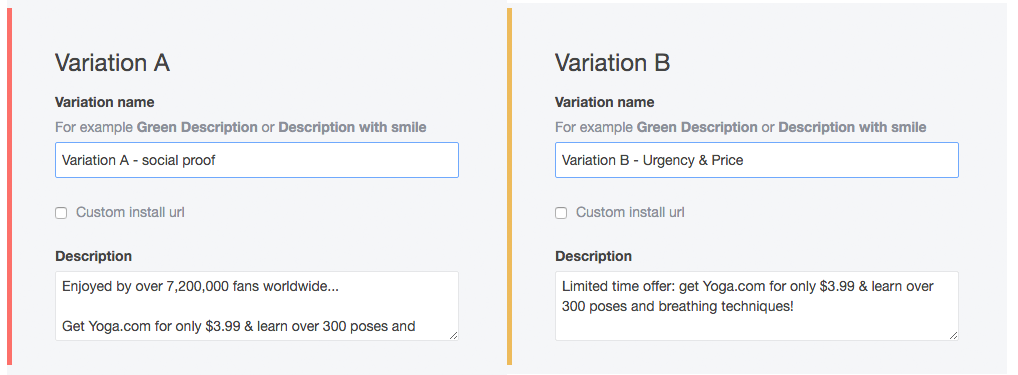
Most description tests have to do with the first paragraph or even the very first line of text. Perhaps not surprisingly for many marketers, visitors rarely go beyond the “read more” button and full text hardly increases installs and boosts conversion rate. People will read the first couple of words and then make a decision on mobile app install. About 1% of all page visitors take time and effort to read the full description.
Below there are some of the common one-liner description tests marketers run within optimization of mobile app and conversion rate increase activities:
Sometimes, even one word can make a difference. One user acquisition manager at a health app shared a story where he removed “please” from a mobile app description (the message was “please, be safe with prescription drugs”) and saw a 31% lift in conversion rate after running an experiment on Google Play. “Stop being so polite” was his advice to the online mobile marketing community.
On average, we’ve seen a maximum increase in conversion rate of 59,6% after description a/b testing across different app categories.
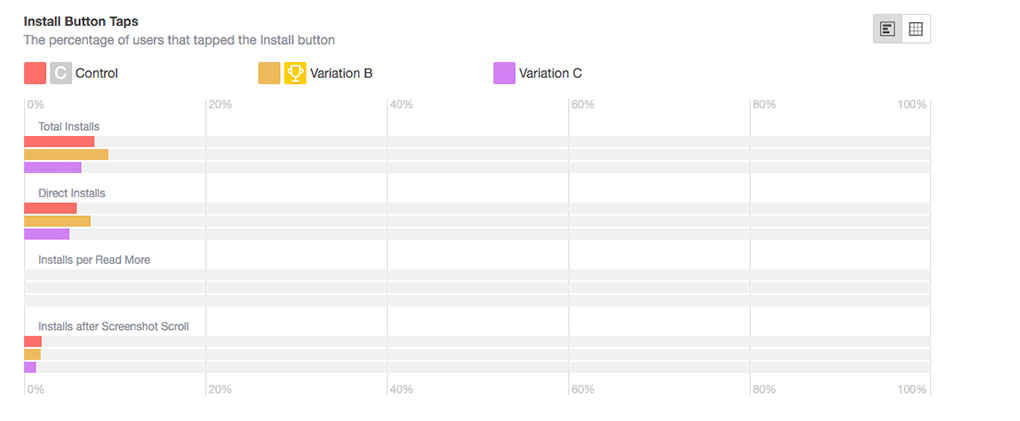
“Conversion rate is the only metric I care about, ” I hear that a lot from user acquisition managers who run a/b tests. By following visitor path on the mobile app page in a store, they see which events triggered an install. You can compare how many people installed the app as soon as they got to the page (direct installs) with those who scrolled and “read more” before contributing to your conversion rate.
As install isn’t a commitment to use a mobile app or even open it; many will install the app after spending zero time on the store page. Some of the popular sources of direct installs are the publisher’s website, word-of-mouth, and traditional marketing campaigns. Machine Zone, Supercell, King, Wargaming, Big Fish, Good Games Studios, and other big players that use TV as one of their marketing channels enjoy a high volume of direct traffic and instant installs which undoubtedly skyrocket their conversion rates.
On average, 15 to 20% of users scroll screenshots past the first one. Obviously, this very first screenshot should be designed for maximum conversion rate. To increase scroll rate and app store page engagement, marketers experiment with different colors for each screenshot. Another popular way to increase visitors’ engagement and therefore conversion rate is to design screenshots as frames of a larger canvas.
Related: Read more about how to design converting screenshots here.
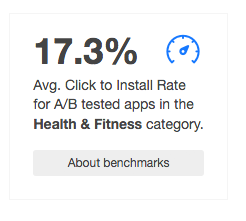
How do you know if your baseline or post-experiment app page conversion in a store is any good? When you run A/B tests, you can set realistic conversion rate goals for your app store optimization activities using industry benchmarks. For each test in Games, Entertainment, Social Networking, Health and Fitness, and Education categories, the software shows how you measure up to your mobile app category competitors.
Related: Check out the app page conversion rate benchmarks report for 2015 here.
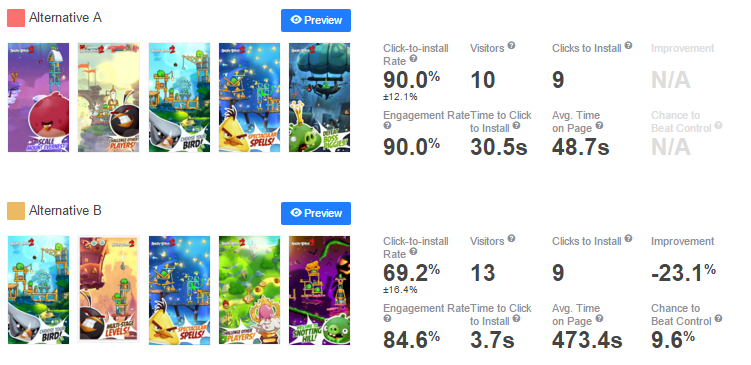
Engagement rate is somewhat of a barometer for the page design appeal. It helps marketers figure out if the creatives need more design and editorial work to empower their ability to increase installs. Engagement as an app store performance metric describes any interaction with the content. High-impact creatives make visitors click more, thus increasing overall conversion rates. You can see it in the proportion of “explored” vs. “bounced” visitors. Marketers often think of the engagement rate for each screenshot as a separate ad unit and measure the impact of creatives on installs increase separately and as a whole.
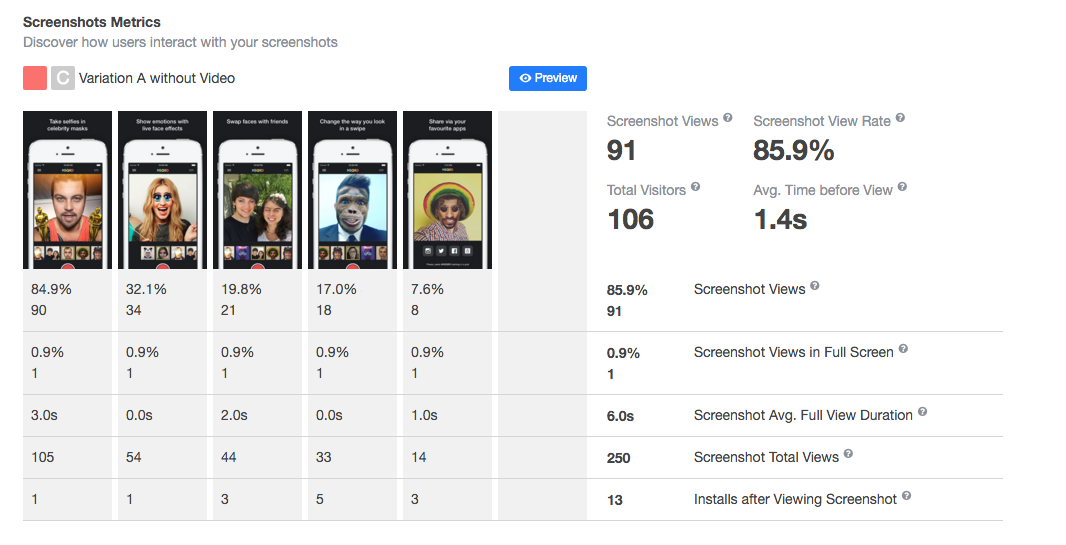
For each screenshot, marketers can get a breakdown on how many people viewed it, how long, and how many installs each one brought. These data may help to identify the need for rearranging screenshot order thus increasing conversion rate. Normally, we see that few visitors scroll to the last screenshot, so the main focus for design and editorial should really be on the first two as they are game changers when it comes to installs increase.
Another telling metric is the number of views in full-screen mode. Few people expand screenshots. It’s critical to make sure your caption fonts are large enough to be visible as you browse the store without going into full screen. Obviously, very few, if any, will zoom in on anything on a screenshot. Sophisticated details in app store design creatives will likely to go unnoticed 99% of the time having zero contribution to your conversion rate increase.
Related: Read how SongPop2 increased its conversion rate with larger fonts and bolder colors here.
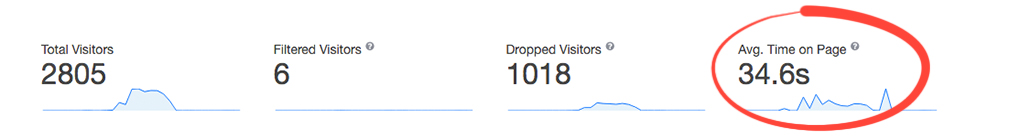
Mobile app marketers can look at the average session duration not only to gauge engagement rate but also to identify potential issues with marketing campaign targeting. This metric is especially telling if you segment users to measure session duration for a specific traffic source, region, device, OS, or demographics. Detailed reports will give you a more accurate representation of your app store page performance. These insights should be used in further marketing activities for increase of conversion rate.
However, with the average time on page, there’s one catch. In case a visitor leaves the alternative page and then returns in a couple of hours to install the app, the system calculates this whole time as his average time on page. This is rare, but something to be aware of, as it can screw up your experimental data on user behavior on app store pages. It’s always better to try and pull the whole dataset and single out the outliers.
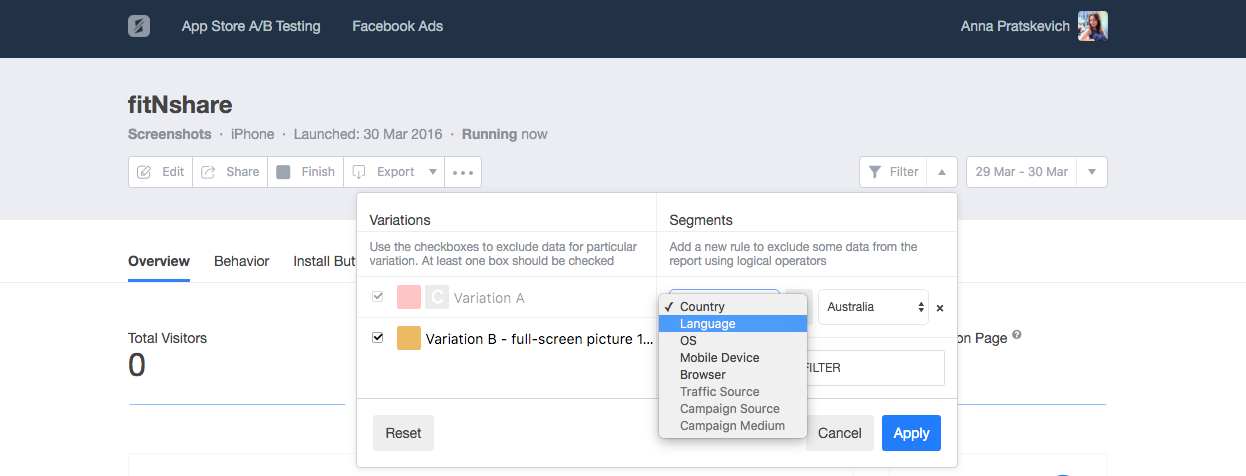
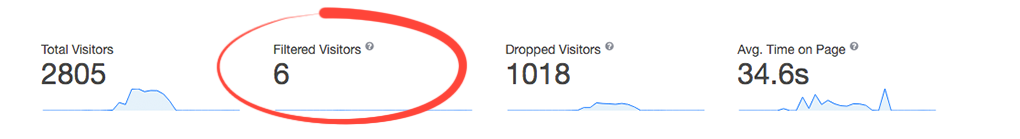
It’s generally a good idea to filter yourself, your user acquisition team, designers, clients, or anyone else you don’t want to see in your experiment results. Use custom filters to exclude IP addresses, operating systems, and other things. Сonsequently, you’ll get pure statistics on mobile app installs and these data should be applied in further activities for conversion rate increase.
Note: you can find your public IP address if you google “what’s my IP address” or ask the IT department about company’s IP addresses and subnets.
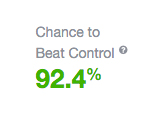
Smart software can help strike a balance between having a large representative sample and overspending on paid traffic for the test. As you run your experiment, SplitMetrics smart assistant will show you how many installs per variation you will need to get statistically significant results. Usually, it’s about 100 installs per each variation.
Related: Learn other tips on how to run tests to get statistically significant results on conversion rate and avoid common marketers’ fails here.
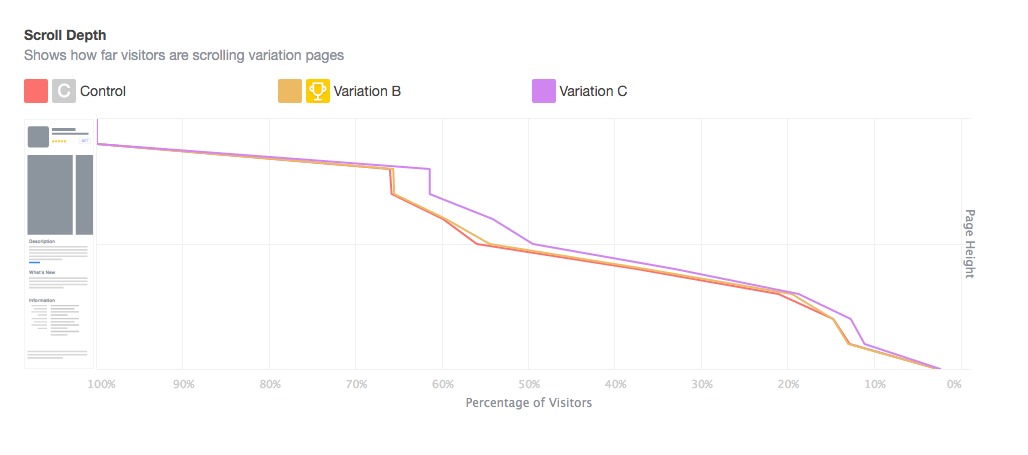
Scroll depth report gives marketers data on how far visitors are scrolling and where most will stop. This helps to understand visitor behavior and optimize for better engagement and conversion rate. For many marketers, it also makes a great case for prioritizing app page redesign. Some use it to show their boss how design changes worked for the app page performance beyond conversion and install increase numbers.
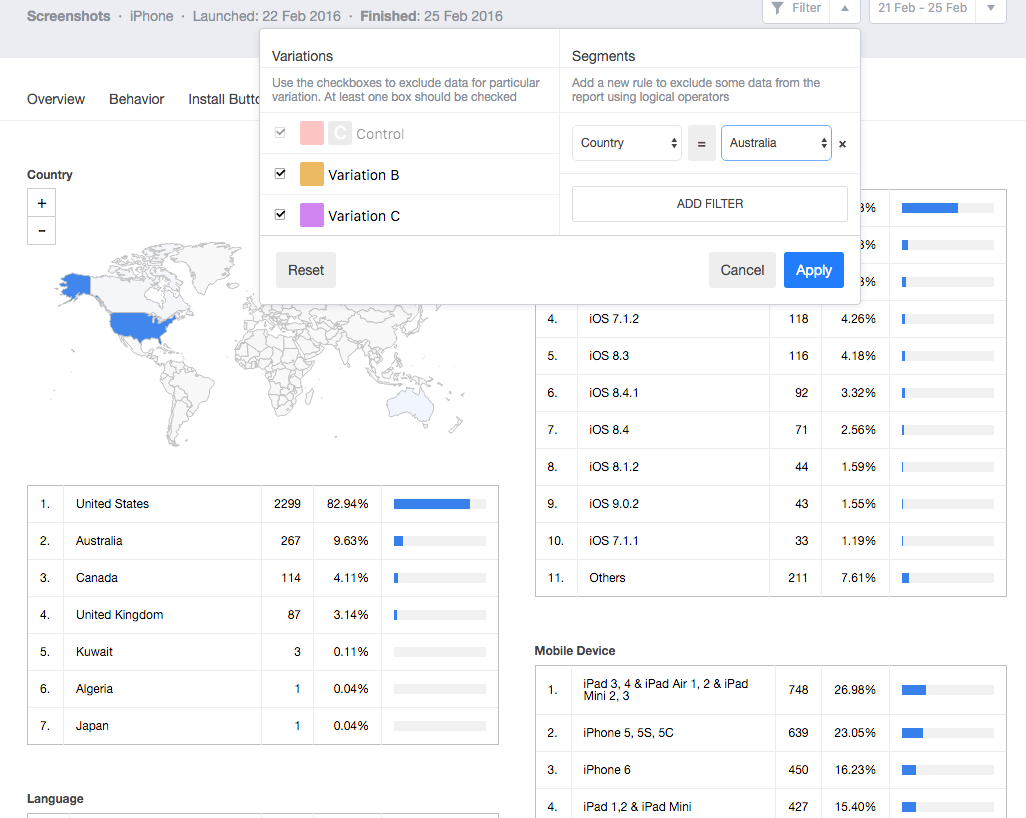
Advanced segmentation option helps you single out certain subsets of data and see changes in demographic trends for your mobile app. For example, marketers can track the impact of localization on conversion rate increase within the new market. Some other cases of use include tracking the difference in how women and men interact with campaign creatives triggerштп installs increase. Also, marketers will sometimes look at the results for different age groups to validate campaign targeting.
Looking at conversion rate numbers is scratching the surface of what you can do with app store optimization. With advanced app store page analytics, you can get rich data about your app page visitors: see the breakdown of installs by each event that triggered it, look at you app page visitors’ scroll journeys, filter what matters for conversion rate increase, and track how your mobile app measures up to the competition in its app store category.