Apple Ads Cost: Evaluation and SplitMetrics’ CPA, CPT, CR, TTR Benchmarks for 2026
 Gabriel Kuriata
Gabriel Kuriata
Gabriel Kuriata

How much does it cost to run Apple Ads campaigns? It depends. Each app category and target market is different, with varying user journeys and behavior patterns, competitive landscapes, as well as monetization and seasonality trends.
Performance optimization is critical: app store optimization (ASO), strategic bidding, keyword selection, and targeting will have a tremendous impact on our profitability. But in terms of actual costs and overall spend, they’ll always be constrained by the boundaries set by the market.
Consequently, answering this question requires fresh market data and a good understanding of Apple Ads metrics and optimization principles, especially those related to bidding and conversions.
First, for proper context, let’s have a quick look at the latest highlights from our most recent Apple Ads’ Benchmark Report 2026 for search results ads:
These figures come from our latest “Apple Ads Search Results Benchmarks Report 2026”, based entirely on SplitMetrics’ campaign data aggregated in 2025. We’ll be using data on search results ads throughout the article to illustrate how Apple Ads costs are determined.
Significant differences across these metrics confirm that Apple Ads costs are variable and driven primarily by user behavior and the competitive landscape, requiring a different approach to achieve profitability. To understand this relationship, let’s discuss how costs in Apple Ads are actually determined.
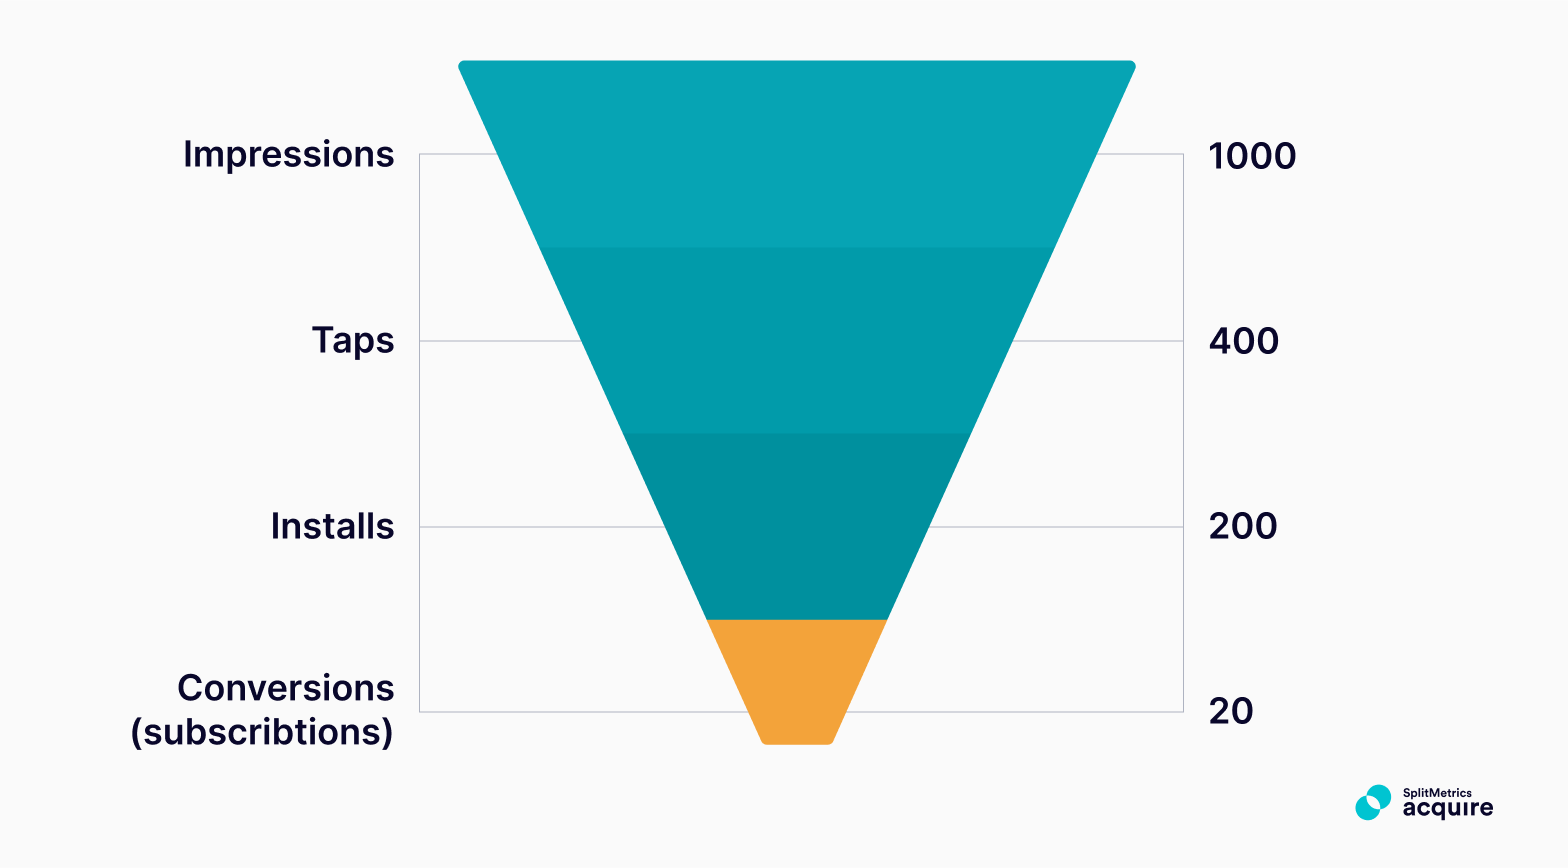
Apple Ads utilizes a bidding system to determine which ads are displayed, charging advertisers only for taps on them, regardless of impressions. The key cost-related metrics available are:
CPT and CPA are driven by competitive bidding and depend significantly on tap-through and conversion rates.
Both are highly dependent on user engagement and behavior, and these vary significantly between categories. An above-average CR in Entertainment lowers CPA, but signals potential considerations for newcomers to the category, trying to reach a very focused audience and capture their attention from established brands.
Consequently, to draw the correct conclusions from these benchmarks and evaluate the potential Apple Ads cost, we need to have a good understanding of user journeys and preferences from a particular category.
To understand how app categories affect Apple Ads cost levels, first, let’s compare cost-related metrics for them.
Seasonal events drive significant surges in search volume for specific, intent-driven keywords, and seasonal trends significantly affect user behavior and demand for certain app categories. Several predictable seasonal and industry factors likely contributed to the CPT spikes for Sports apps, including Super Bowl LIX (February 9, 2025) and the “Fitness Resolution Peak”.

Sports apps not only had the highest CPT (over $14.40) but also led in CPA ($19.71), confirming that advertisers were paying premium prices to acquire users in this category, motivated by high potential gains during seasonal events. As always, Finance apps maintained a high CPA due to intense competition for the category’s high LTV users.
The answer lies in user journeys, impacting two key metrics: tap-through and conversion rates. Let’s examine their averages for categories to understand this process.
Let’s take a look at the Apple Ads average TTR for the search results campaigns within the top 15 app categories in 2024.
TTR fluctuations occur at both category and individual app levels due to several interconnected factors that evolve quarterly. Category-level factors include: seasonal user behavior, competitive landscape shifts, market saturation and fatigue.
Categories with high average CR indicate strong product-market fit, where users have clear intent and apps effectively address specific needs. High CR suggests users are finding apps through relevant, high-intent keywords rather than broad discovery terms. High CR often correlates with established brand recognition and presence within a category. A low average CR may indicate saturated categories with many similar options, increasing discovery time.
Seasonality is another critical component determining the cost of Apple Ads campaigns, definitely adding nuance to the figures presented above.
Sample performance benchmarks for Apple Ads search results ads, based on SplitMetrics’ campaign data. Find more detailed charts analysis in the “SplitMetrics’ Apple Ads Search Results Benchmarks Report 2026”
Seasonality significantly impacts the cost of Apple Ads by influencing competition. Cost-per-tap (CPT) and cost-per-acquisition (CPA) generally tend to peak around specific periods, like Black Friday or Christmas.
Advertisers are incentivized to compete to reach highly-engaged consumers looking for special, seasonal occasions. Conversely, a lull often occurs in late summer, with August typically being a more cost-effective month for advertising due to lower overall competition. However, seasonality patterns can vary significantly by country and category.
Advertisers are advised to monitor the market and adjust their strategies and cost estimates to take these fluctuations into account.
Apple Ads costs vary significantly between markets due to differences in competition, advertiser demand, and the lifetime value (LTV) of users in each region, a metric significantly dependent on a given audience’s purchasing power.
North America consistently records the highest CPT, and EMEA follows a similar pattern but at a slightly lower cost. Overall, North America and EMEA show rising costs driven by seasonal competition, while APAC and LATAM offer more stable and affordable ad opportunities.
An Apple Ads cost is “good” when your campaigns are profitable. It should always be analyzed within the context of your user’s lifetime value (LTV) or achieved return on ad spend (ROAS).
The key value of Apple Ads lies in their ability to acquire valuable users for an app, with an exceptionally high LTV compared to many other advertising platforms. Consider the following:
| LTV | 0D | 1D | 7D | 14D | 30D | 45D | 60D |
| iOS | $0.3937 | $0.4447 | $0.6065 | $1.24 | $2.23 | $2.68 | $3.17 |
| Android | $0.0086 | $0.0093 | $0.0112 | $0.0129 | $0.0129 | $0.0142 | $0.0162 |
A comparison of the lifetime value (LTV) of iOS and Android users for the same app. Data source: app analytics of an app promoted by SplitMetrics Agency.
This key value of Apple Ads as an advertising channel is reaffirmed regularly, like in Singular’s ROI Index 2024 and again in the 2025 edition of the report. The platform targets highly engaged App Store users, more likely to invest in subscriptions or make valuable in-app purchases.
The key cost metrics for Apple Ads are CPT and CPA. However, most campaigns are optimized for goals specific to a particular app. Consequently, Apple Ads costs are evaluated within the context of the desired cost per subscription, in-app purchase, or the value of achieved return on ad spend for a particular campaign.
Choosing the right metric to optimize for in Apple Ads will also directly impact your campaign’s cost and effectiveness.
For example, when you optimize for a rare conversion like an in-app subscription, your cost-per-subscription will be significantly higher than your CPA, as only a fraction of users downloading an app will sign up for it. It will simply take more impressions of both your ads and your app’s product page before that event occurs.
Conversely, optimizing for a common conversion, such as a paywall view, may result in a much lower cost per goal. Since this event happens more frequently, you can acquire many more “conversions” for the same budget. However, in such a case, you should keep a close eye on the actual revenue inflow.
There’s no clear answer to which approach works best, but there’s one clear takeaway: monitor and analyze costs on both keyword, ad, and campaign levels.
Apple Ads costs are driven by competition grounded in addressing user intent and preferences, highly dependent on tap-through and conversion rates. This points to many methods of lowering the costs of campaigns.
ASO is critical for Apple Ads campaigns. App icon design greatly impacts tap-through rate, and screenshot optimization is essential for driving downloads. Even a single-digit uplift in any of these metrics will bear a noticeable effect on your CPT and CPA.
ASO has a broad scope of activities, and the more effort you put in launching engaging in-app events, focusing on having your app featured, the bigger the payoff in terms of paid user acquisition costs will be.
Targeting the right keywords in Apple Ads means striking the right balance between their popularity and competition. Spend on keywords that also enjoy high organic positions can also be strategically controlled to reduce overall costs.
A proper campaign structure in Apple Ads intuitively categorizes keywords into brand, competitor, and category types that best reflect search intent behind them and allows better control of costs concerning their differing tap-through and conversion rates.
There are multiple targeting options available in Apple Ads that may help you improve conversion rates, resulting in lower acquisition costs. These are highly dependent on your app. For example, in some cases, it might make sense to target particular device types or new and returning users separately.
Scheduling is a configuration option that might work well for some apps that have time-sensitive use patterns (like food delivery/tourist apps in the evening, etc.), as it displays your ads on a specific time of day or day of the week.
Custom product pages allow precise personalization of your app’s product page, depending on keyword or ad placement. Because of this, they typically enjoy above-average conversion rates, and implementing them always has a positive impact on overall campaign performance.
Bidding is the most critical component of Apple Ads’ optimization, with bid change frequency and increment size vital in maintaining optimal costs. In essence, swift reaction to ongoing changes minimizes the periods of overspending or falling behind competitors.
This is one of the reasons Samba, our AI, can make 10x more bid adjustments to a single keyword in Apple Ads in the same period than manual changes, improving ROAS and revenue by over 55% for selected campaigns while maintaining spend levels.
Introducing additional placements in Apple Ads may improve your app’s visibility and brand recognition, directly impacting the effectiveness of your brand and competitor campaigns and overall performance.
Apple Ads costs vary based on user behavior and competition, influenced by factors like app category, seasonality, and market. Optimizing for the right metrics and implementing strategies such as ASO, precise targeting, and bid automation are key to lowering costs and ensuring profitability. Make sure to review your strategy cyclically and study performance benchmarks for relevant categories to stay ahead of trends and keep Apple Ads costs under control.