A/B Testing — 27 Apr 2023
Calculating Sample Size for A/B Testing: Formulas, Examples & Errors
 Gabriel Kuriata
Gabriel Kuriata
Gabriel Kuriata

One of the most popular questions app publishers ask our customer success managers is how much traffic they need to acquire for their experimental landing pages, for their A/B tests to be valid and provide them with a reasonably accurate picture.
The answer is simple: you need to accumulate enough visits to reach a result with a confidence level appropriate for your test. Testing methodology, the objective of a particular test and your business goals determine the minimum required sample size (which in practice means the minimum number of visits on a target destination, be it an app’s product page, a custom product page or a simulation page used in early stages of development).
Unfortunately, there is no answer with a magic number that will fit every single experiment. An optimal traffic volume for mobile A/B testing also depends on such factors as a traffic source, app’s conversion rate, and targeting. There can be significant differences between apps from various App Store categories, which might influence the total cost of testing.
Now let’s get to the main point: how to determine the sample size for A/B tests? In case of sophisticated systems, automation takes most if not all problems off your back (such is the case of our A/B testing service, SplitMetrics Optimize). You can run a sample size calculator if you wish, but it’s good to have a full understanding of it as sample size has a considerable effect on checking the significance of the observed difference in variation performance.

In this post we explore three areas related to the problem of calculating the right sample size for mobile app experiments and A/B tests. First, we focus on the business aspect of it. For a more in depth perspective, we also review a widely used sample size measuring method that helps to make statistically valid decisions (based on the results of your mobile A/B testing). Additionally, for all those nerds in us we included some math & formulas. We know that among our beloved readers there are people who like to look at the machinery at work.
In the world of mobile marketing – app growth & user acquisition in particular, the term “sample size” refers to the amount of visitors sent to a given variation of an app’s product page on any app store out there during an A/B test.
The higher the number of people who view and have a chance to interact with your variations (custom product pages on the App Store or custom store listings on Google Play), the more reliable will be your test results.
From a business perspective, the right sample size for your test is the one that is financially viable and that allows to achieve results with a trustworthiness level adequate to a specific goal. This is why a sequential A/B testing method is recommended for pre-launch validation of big design ideas – despite significantly higher traffic required to reach the minimal confidence level of 80%. It’s also the reason why the cheapest, multi-armed bandit method might be best for small seasonal changes and why the Bayesian method is the golden standard for the industry.
In our case, choosing the right sample size is all about ROI, not discovering the meaning of life (besides, we know it’s 42, thanks to the “Hitchhiker’s guide to the galaxy”). In most cases, we’re striving to find a measurable conversion rate difference… with minimum cost.
To better understand how it all works, we’ll start with showing how it’s done in our platform for A/B testing, SplitMetrics Optimize.
Return on investment. This is how the biggest app publishers approach this matter and it makes sense. When your ad budget exceeds $200k a month on Apple Ads alone, A/B tests are an integral part of their “growth engine”, meaning they come in large numbers and need to come within the boundaries of a certain budget, yet deliver what is expected from them. This is directly reflected in how our A/B testing platform, SplitMetrics Optimize works.
As you’d expect, the entire process of calculating the right sample size is standardized and automated. The system requires a certain amount of traffic to return statistically significant results.
In the context of cost-effective A/B testing that’s expected to drive meaningful decisions, a word on the Minimum Detectable Effect (MDE) is necessary. It’s a minimum improvement over the conversion rate of the existing asset (baseline conversion rate) that you want the experiment to detect. By setting the minimum detectable effect, you define the conversion rate increase sufficient for the system to declare the new asset winner. This parameter has a dramatic effect on the amount of traffic required to reach statistical significance. Our system can calculate MDE, but we strongly recommend setting it by yourself. This parameter depends on your own risks – money you’re ready to allocate for the traffic acquisition and time you can wait for the experiment to run.
Additionally, SplitMetrics Optimize offers three methods of A/B testing of apps’ product pages.
| Bayesian | Sequential | Multi-armed bandit | |
| Best for | Live apps, periodic & minor changes | Pre-launch, big changes & ideas | Seasonal experiments |
| Interpretability | Improvement level, winning probability, chance to beat control | Improvement level, confidence level | Weight |
| Key benefit | The golden middle methodology | High confidence | Speed & low cost |
| Recommended sample size* | 500 per variation | 1000-1500 per variation | 250 for the least performing variation |
In the case of the sequential methodology, the minimal sample size required is also dependent on the preset required confidence level. In each case, a test can be continued after reaching the minimal threshold.
Why is choosing the right sample size so important? Why is understanding how it works important for a marketer relying on automated platforms such as SplitMetrics Optimize? Why 500 visits and not 250? We’ll discuss this on an example of MSQRD app:

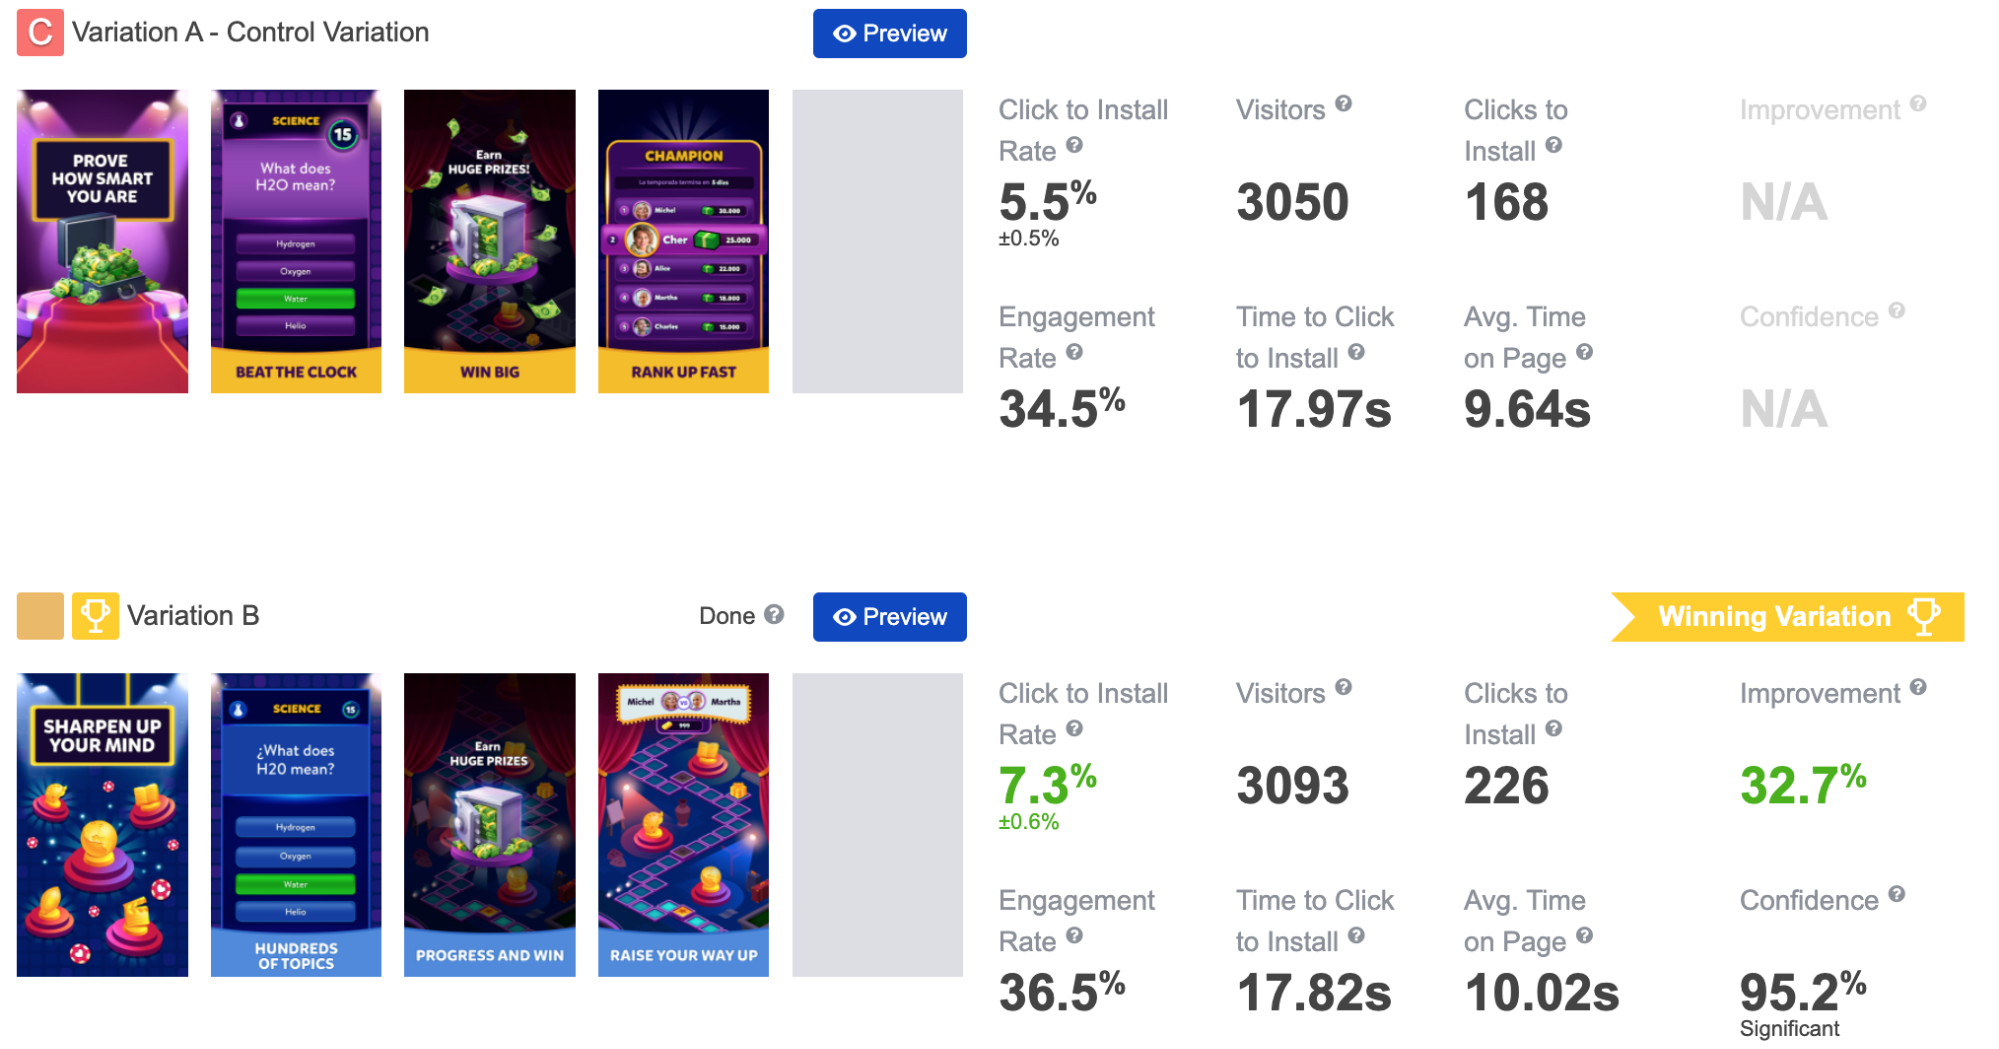
Let’s consider that MSQRD decided to check if changed order of screenshots (Variation B) favors a better conversion rate. Presume that we got the following results after filling variations with 200 different users each:
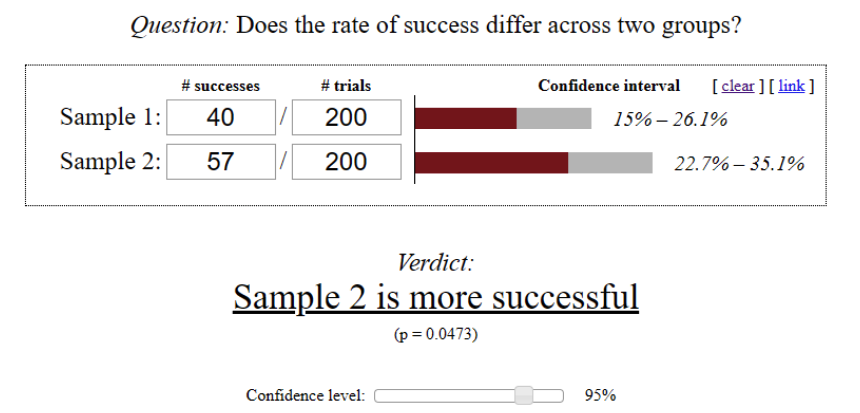
Thus, the observed difference in variations performance shows that we have statistically significant results at the confidence level of 95%. The picture above shows the result of such validation performed using online mobile A/B testing calculator.
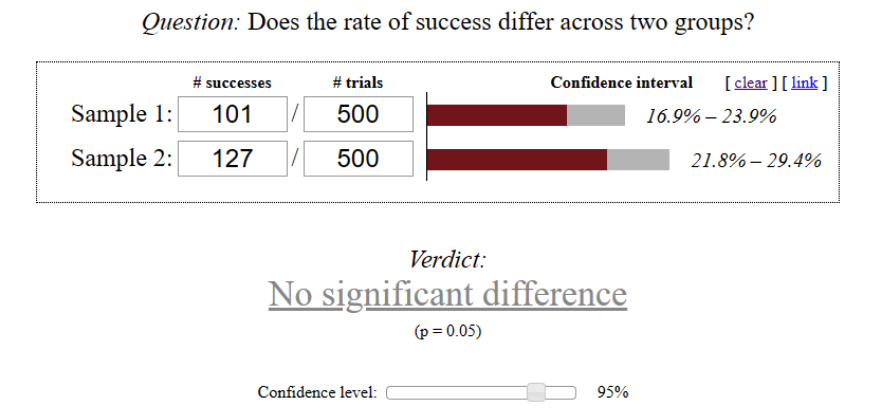
Let’s imagine we didn’t finish the experiment at reaching the above-mentioned result and continued driving traffic. When each variation got 500 users, we got the following results:
In this case, the significance checking will show that the observed performance difference isn’t that statistically significant at 95% confidence level.
Is the example we examined realistic? Sure, it is.
For instance, when the exact conversion values of variations A and B are 20% and 26% respectively, these values are within the appropriate confidence intervals for cases with both 200 and 500 visitors per variation.
According to this example, if we finished the experiment at reaching 200 visitors for each variation, it would be possible to come to the conclusion that variation B performed better. However, if we finished the test after having 500 visitors on each product page variant, we could conclude that both variations are interchangeable. Pretty confusing, isn’t it?
It raises the legitimate question:
How many users do we need to run trustworthy mobile A/B tests?
Thus, we need to figure out what sample size is necessary for getting statistically significant results in the course of our mobile A/B testing.
Now, let’s review how to calculate a sample size for A/B tests based on statistical hypothesis testing.
First, we need to understand what null hypothesis really is. In mobile A/B testing, the null hypothesis is normally represented by the assumption that the difference between the performances of variations A and B equals to zero.
It has been theoretically proven that the sample size required for acceptance/rejection of the null hypothesis for KPI expressed in terms of the proportion (conversion rate in our case) depends on 5 of the following parameters:
Let’s clarify the above-mentioned parameters and determine the sample size for our MSQRD example:
Thus, the conversion rate value of our control variation A is 20% (CR(A) = 0.2). Our example presumes that:
In the course of sample size determination, some calculators for A/B testing request minimum conversion rate difference to be formulated in relative terms instead of absolute. In our example, the minimum difference of 6% in absolute terms corresponds to the relative difference of 30% (20% * 0.3 = 6%).
As it was clarified in our post on mobile A/B testing results analysis, the sum of confidence level and significance level values should be 100%. Let’s choose the confidence level of 95% and the significance level of 5% for our MSQRD example as these are the values of the parameters which are most commonly used in A/B tests.
There are multiple methods to calculate a sample size, but let us focus on two: one-tailed and two-tailed. The choice depends on what we want to check.
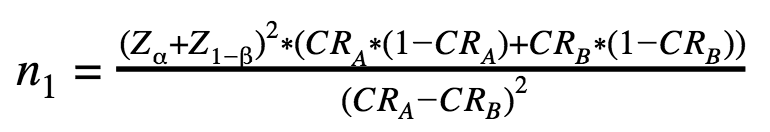
Here’s an A/B test sample size formula for one-tailed tests:
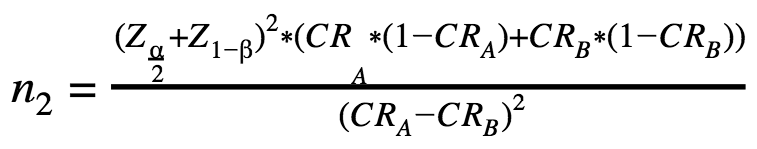
In case of a two-tailed testing, we use the following A/B testing sample size formula:
n1 – the number of visitors for each variation А and В in case of a one-tailed test;
n2 – the number of visitors for each variation А and В in case of a two-tailed test;
Z – standard score or Z-score.
The only difference between these two A/B testing sample size formulas is that Z(α) is used in the first one while the second uses Z(α/2).
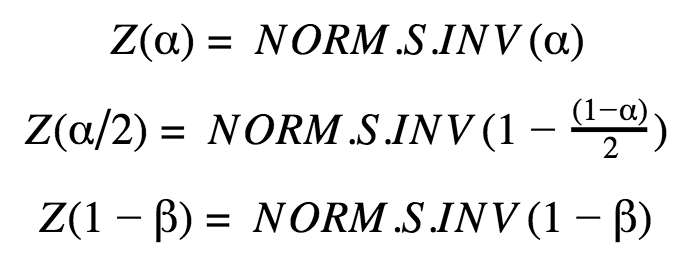
The values of Z(α), Z(α/2) and Z(1-β) can be calculated with the help of the Excel function NORM.S.INV:
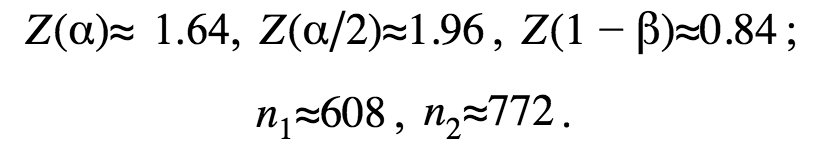
At making the calculations for the MSQRD example we’ve mentioned above and rounding the results, we’ll get the following values:
These calculations can be made with the help of the free-to-use software Gpower.
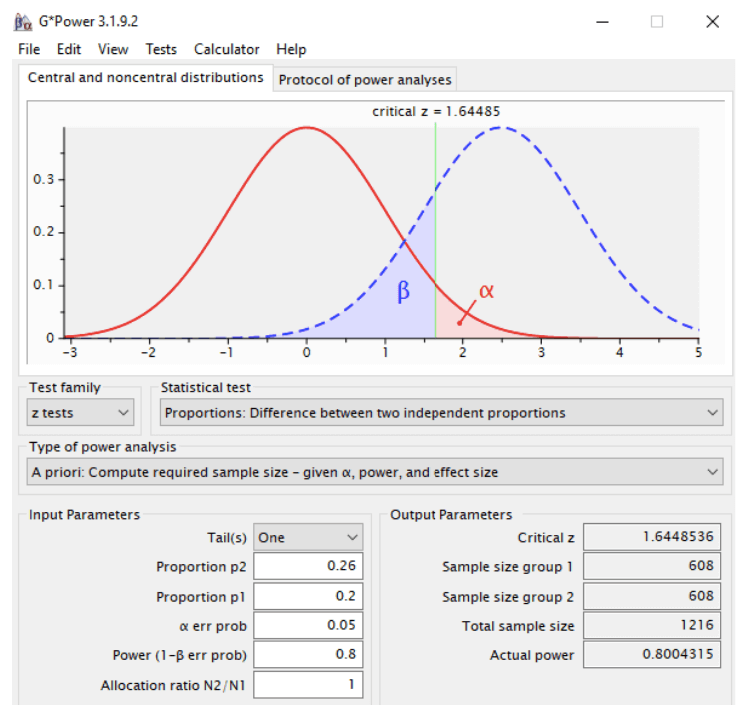
Therefore, if CR(A) is 20% and the estimated CR(B) value is at least 26%, we’ll have to run our experiment until each variation gets 608 different visitors to check the statistical significance at the significance level of 5% and with 80% statistical power. Thus, the total number of the experiment visitors should be 1216.
In case we are interested in both positive and negative conversion rate differences, the results will be slightly different.
If CR(A) is 20% and we need to find 6% difference in absolute terms, we’ll have to fill each variation with 772 different visitors to check the statistical significance at the significance level of 5% and with 80% statistical power. Therefore, the total number of visitors within this mobile A/B testing should be 1544.
Thus, if n is the sample size calculated according to the method described above, to compare variation B with control variation A, we’ll need n visitors for variation A and n visitors for variation B (the total is 2*n visitors).
But what should we do if the experiment we run has 3 variations?