A/B Testing — 18 Sep 2020
SplitMetrics A/B Tests: How to Win with No Winner Experiments
 Anastasia Sidoryk
Anastasia Sidoryk
Anastasia Sidoryk

Running A/B tests implies that you may end up with a no winner result. In fact, getting a winner on the first A/B experiment that you run is highly unlikely. Although finding a variation with better conversion is the ultimate goal, no winner A/B tests are not at all time or money wasters. On the contrary, they can be the source of valuable insights for further A/B experiments.
SplitMetrics enables sequential A/B testing, where the algorithm constantly checks your variations for significance and the amount of traffic left over the course of your experiment.
In an A/B experiment with two variations (A+B), it finishes with no winner If significance is not found and the experiment hits its time limit or maximum required conversions.
When it comes to A/B experiments with more than two variations (A+B, A+C, etc.), the no winner situation happens when all variations score the maximum of required conversions or time limit, and the significance hasn’t been reached.
Read how sequential A/B testing works in SplitMetrics to understand how the platform defines the winner.
We’ve seen a lot of customers getting into a counterintuitive psychological trap: when they don’t get a winner, they may be biased towards the new variation just because they invested resources in the design of a video or screenshots.
But the new design is not necessarily better. In A/B experiments, it’s users who choose, which helps you avoid biased ASO decisions.
So in order to exclude the psychological factor, it makes sense to refer to the A/B testing statistics gathered throughout an A/B experiment. They can be a data-backed basis for further hypotheses and follow-up experiments where the control variation is tested against new treatment variations.
A/B tests with no winner still have Click to Install Rate, or conversion data, gathered. One of the variations in such A/B experiments will show a bigger conversion rate, but it doesn’t mean that this variation converts better than the other because significance is not detected.
We strongly recommend you shouldn’t make decisions regarding the conversion rate based on A/B tests without significance found.
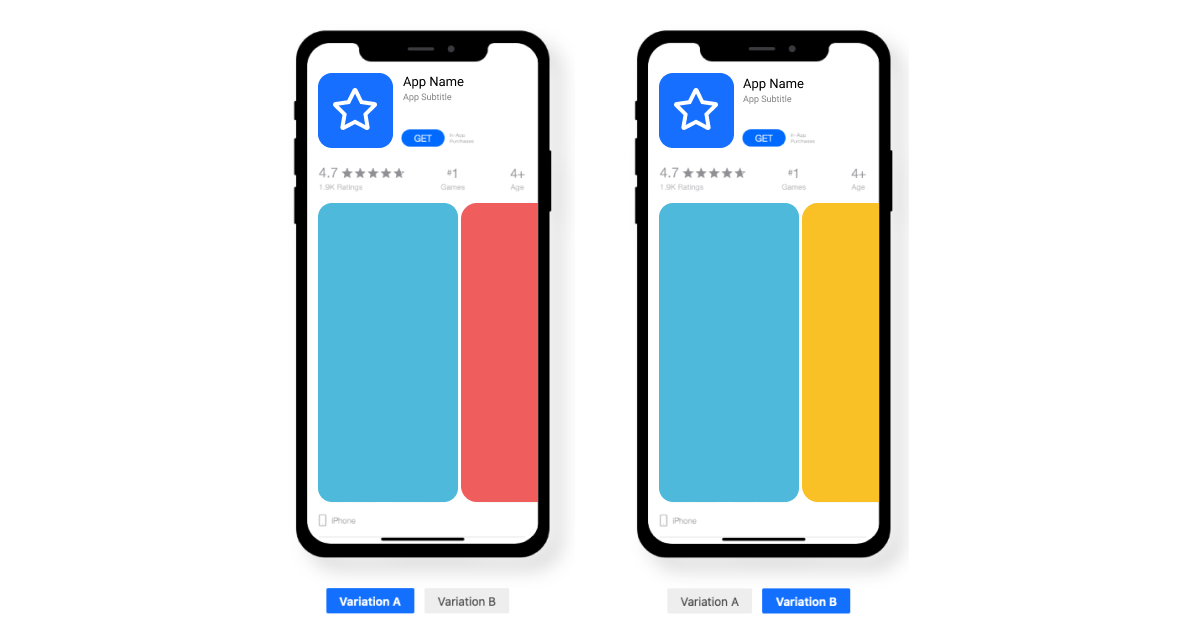
However, other A/B testing statistics gathered will guide you to optimization decisions for future experiments. Let’s say you run an A/B test with two identical variations that differ in screenshot #2:
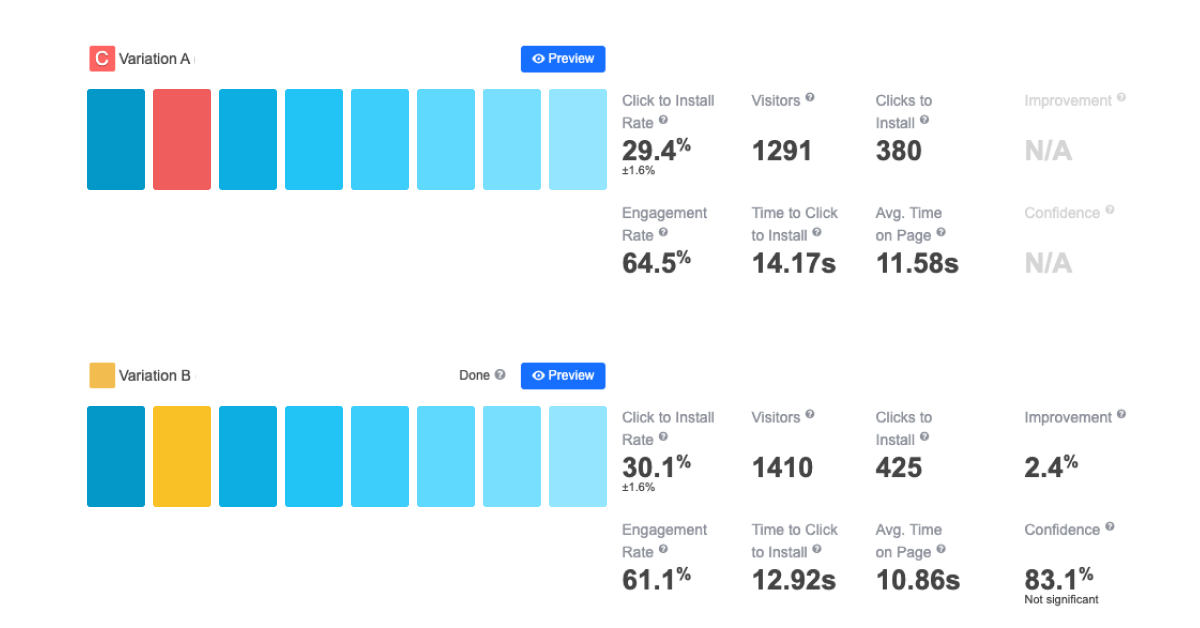
The first thing you may want to look at is Engagement Rate. Variation A outperforms Variation B in terms of this metric, hence bigger avg. Time on Page and Time to Click to Install. The variations differ in screenshot 2, so we can assume that this screenshot prompts users to interact with the page elements more willingly. However, high Engagement Rate may also be caused by the random distribution of visitors between the two variations. To check the random factor, you may want to refer to the Screenshots metrics (See the next chapter “Screenshots metrics in an A/B test without winner”).
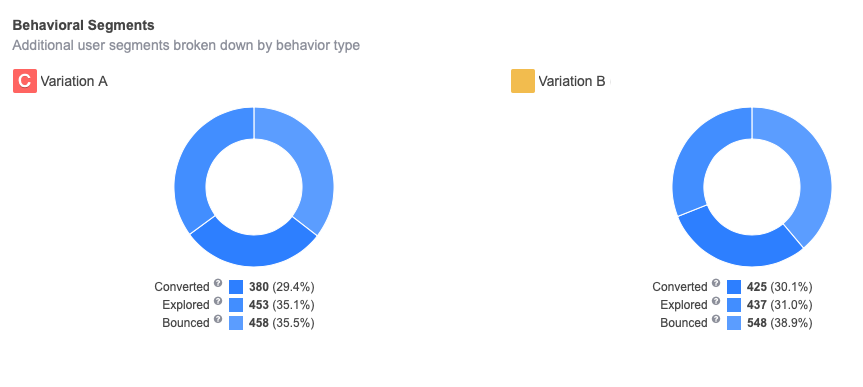
When the two variations in a no-winner A/B test differ only in one of the first two screenshots, we usually look into Bounce Rate and Direct Installs.
In this example, more visitors left Variation B without interacting with it (see the number of Bounced visitors):
However, there’s an opposite situation with Direct Installs – Variation B outperforms Variation A:
Obviously, the Bounce Rates and Direct Installs data are contradictory, so in this situation it’s not advisable to upload the variation with the higher conversion rate to the App Store.
SplitMetrics tracks a direct install when users tap “Get” without any page interaction, in other words, upon viewing it this way:
As more direct installs happened upon viewing Variation B, it might be that screenshot #2 (the only element that differs) was more successful at prompting users to tap “Get”. One screenshot of the first view screenshots can bring in such an improvement if there’s a prominent difference between the two concepts. If the difference is minor, you’re unlikely to get a conversion uplift. So make sure you introduce noticeable changes to the concepts.
Direct Installs are not enough to make a decision: in such cases, we usually recommend analyzing Installs after Viewing Screenshot and other screenshot metrics.
In addition to Bounce Rate and Direct Install Rate, we normally explore other screenshot-related A/B testing statistics from the “Screenshots” tab in the platform. For example:
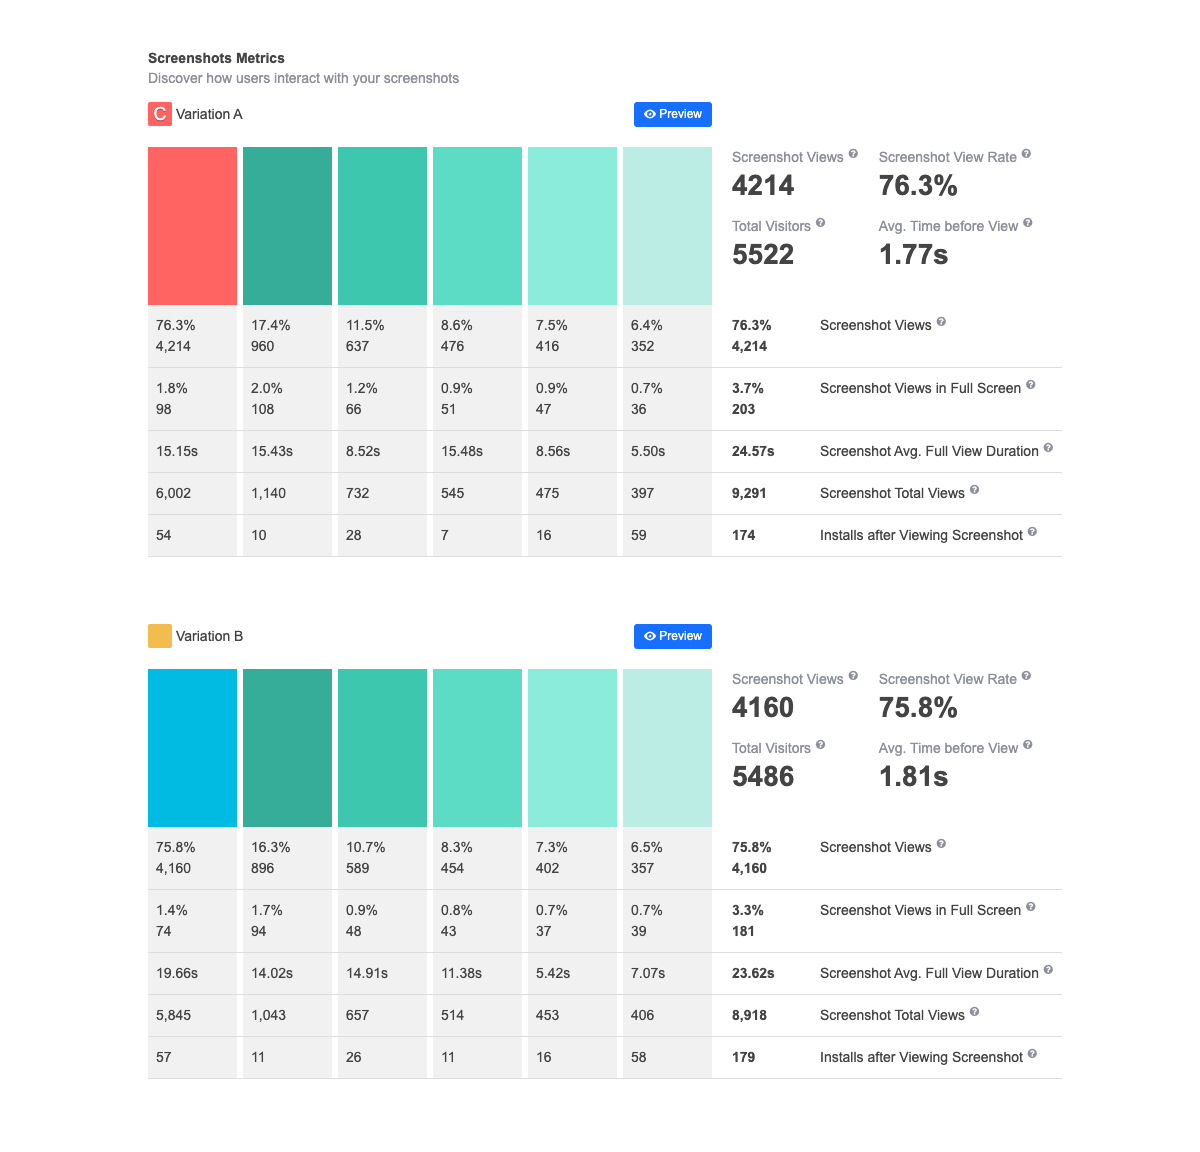
A/B tests gather the Installs after Viewing Screenshot data. Look at this metric for screenshots 2 and 3: if compared across the two variations, the metrics are pretty close – screenshot 2 installs are at 10 and 11, screenshot 3 installs are at 28 and 26. Bigger Install rates of screenshot 3 is an optimization insight: you might want to swap the screenshot and run another A/B test.
Moving screenshots with more Installs after Viewing Screenshot to the beginning of the screenshot gallery might have a positive effect on conversion.
Now let’s look at the stats above and pay attention to another metric – Screenshot Views in Full Screen. Screenshot 2 has the highest rate across both variations, which means that app page visitors tend to open the screenshot in full and examine it, hence such a big value of Screenshot Avg. Full View Duration too.
However, Installs after Viewing Screenshot are only 10 and 11, not much compared to the screenshots nearby. In such cases, you might want to look at what is shown on the screenshot: it’s likely that it contains a lot of small details that users want to explore, but they fail and bounce. So it might be reasonable to zoom in the most important details, place them on the screenshot in the next iteration and run another A/B test.
When it comes to the screenshots metrics, analyze Screenshot Total Views together with Engagement Rate. If both metrics are high, pay attention to the Installs after Viewing Screenshot: a high Install Rate means that visitors are interested in your app’s features; in the opposite situation, there might be issues with the design or the way you position your features, so think of reconsidering the positioning.
Another thing you might want to pay attention to, is Screenshot Views of the last screenshots, which shows the percentage of visitors that have scrolled up till the end of the gallery. Sometimes this metric differs dramatically across variations. It’s likely a variation with the biggest scroll through rate seems more engaging and attractive to visitors.
Check the ultimate guide to App Store screenshots here.
From our experience, when optimizing app store creatives marketers commonly assume that the image gallery with a video will convert better than without a video. Another reason is efforts and resources invested in video production.
Read how Vezet (Russia’s second largest taxi aggregator) understood that video doesn’t work for them by running A/B tests with SplitMetrics – сheck the case.
That’s why it makes sense to run A/B tests to check whether a variation with the video has a bigger conversion rate. Even though such an A/B experiment might finish without a winning variation, we can collect priceless insights for further A/B tests.
This is just the case of one of our customers who A/B tested a static image gallery against the same gallery which starts with a video showcasing the features. Although the result was a no winner situation, we collected priceless insightful metrics.
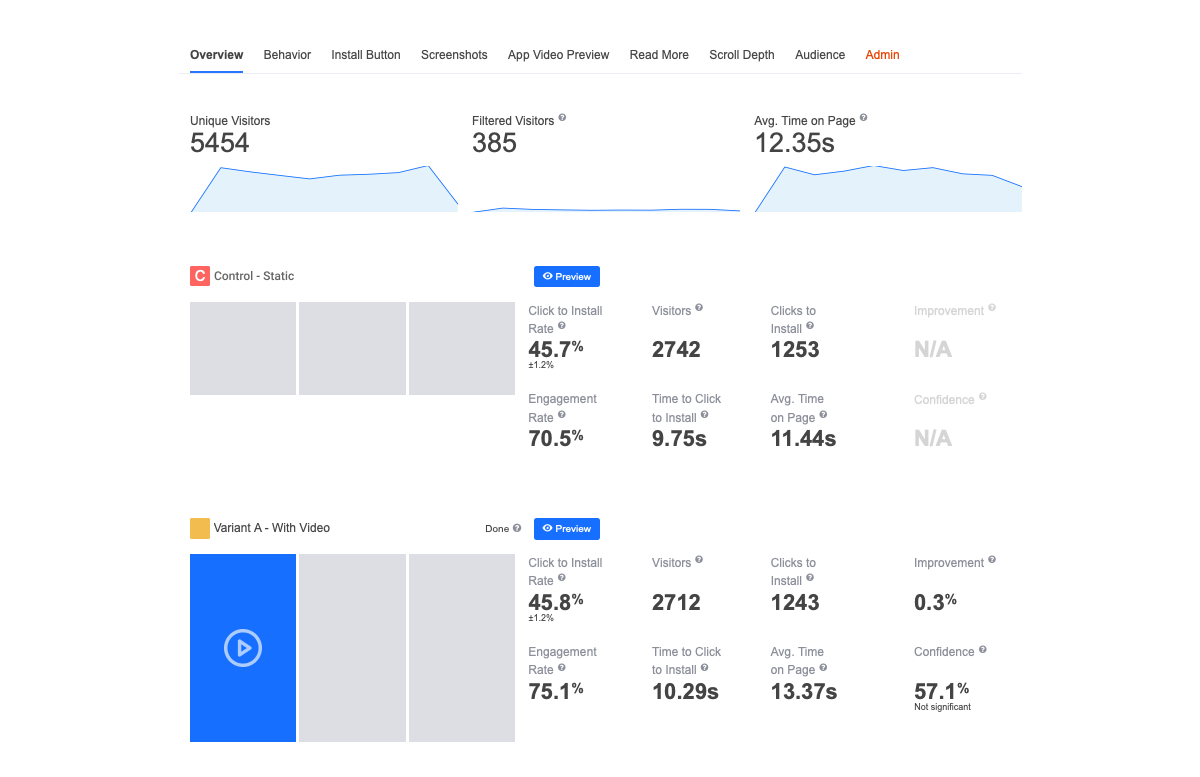
The Engagement Rate metric says that visitors interact with the video variation more willingly. Does it mean they should upload the video to the App Store?
From our experience with such tests, higher Engagement Rate for variations with a video is a common situation. The thing is that App Store videos include an autoplay feature, and we consider the video to be viewed 3 seconds after it starts playing. The user has to do nothing but stay on page and watch. As for screenshots, the page visitor has to scroll them so that we can detect engagement.
Variation A with video has a higher Average Time on Page metric as well. Overall, visitors need less time to explore static screenshots compared to the video, provided it’s long and engaging. So bigger Engagement Rate and Average Time on Page of the variation with the video don’t necessarily mean that you should go with the video variation.
Now let’s dig deeper into the data and see how visitors performed on the pages:
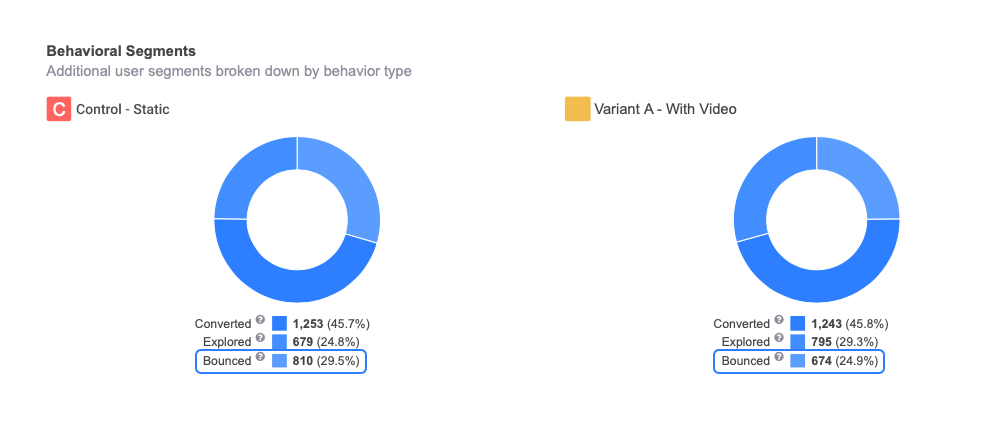
Take a look at Bounce Rate. More visitors bounced from the static image gallery variation and fewer people explored, or engaged with the page without tapping “Get”.
Remember that we track engagement 3 seconds after a user watched the video, so it’s pretty reasonable that Variation A has a higher Exploration Rate. The autoplay feature raises the number of users who explored the video variation, but visitors might leave the page afterwards, if the video doesn’t seem engaging. Pretty close numbers of users Converted mean that the video didn’t make much difference.
Let’s move on to the “Install Button” tab:
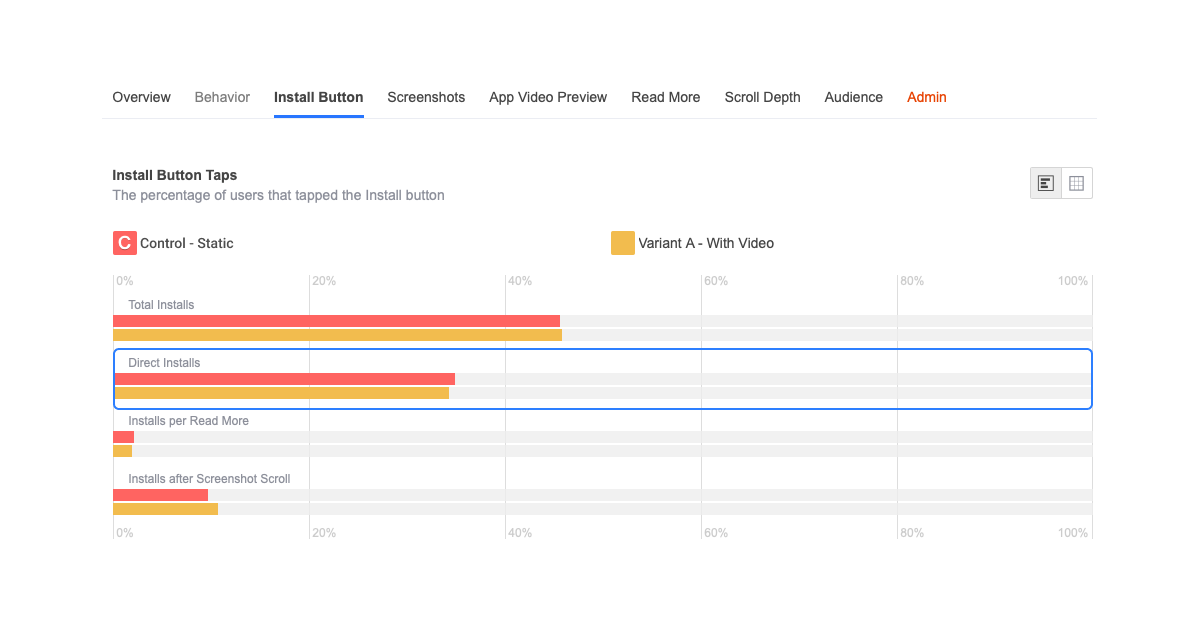
Direct installs are tracked when users tap “Get” without doing anything on the page. When there’s a video at the beginning of a screenshot gallery, a direct install happens before it plays for 3 seconds. In this example, there’s hardly any difference between the two variations in terms of direct installs (34.9% against 34.4%), so the video doesn’t contribute a lot to the increase in conversion – the screenshot-only page brings in almost the same number of direct installs.
In such a situation, a follow-up A/B experiment may include an optimized video where the first 3 seconds showcase the most outstanding app feature.
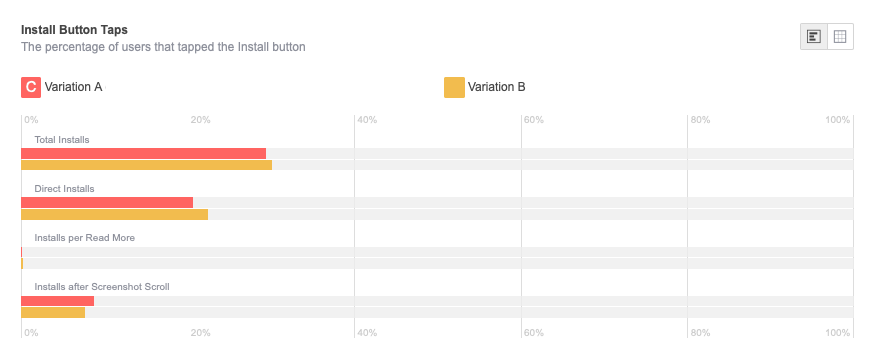
In addition, by comparing Install Button Taps (Direct Installs, Installs per Read More, Installs after Screenshot Scroll), you can get plenty of ideas on what to optimize next:
Keep the description A/B testing for later though, it’s reasonable to start with improving the visuals.
As for the app that we’re analyzing, it makes sense for them to start with A/B testing the first two screenshot positions or the icon. Then they could optimize all the screenshots gallery, and only after that – try A/B testing the description variations.
From the charts above, we can also see that part of the visitors scroll screenshots and install the app (Installs after Screenshot Scroll). The screenshot galleries are identical across the two variations (except for the video in Variation A), but their Installs after Screenshot Scroll are different (9.8% and 10.8%).
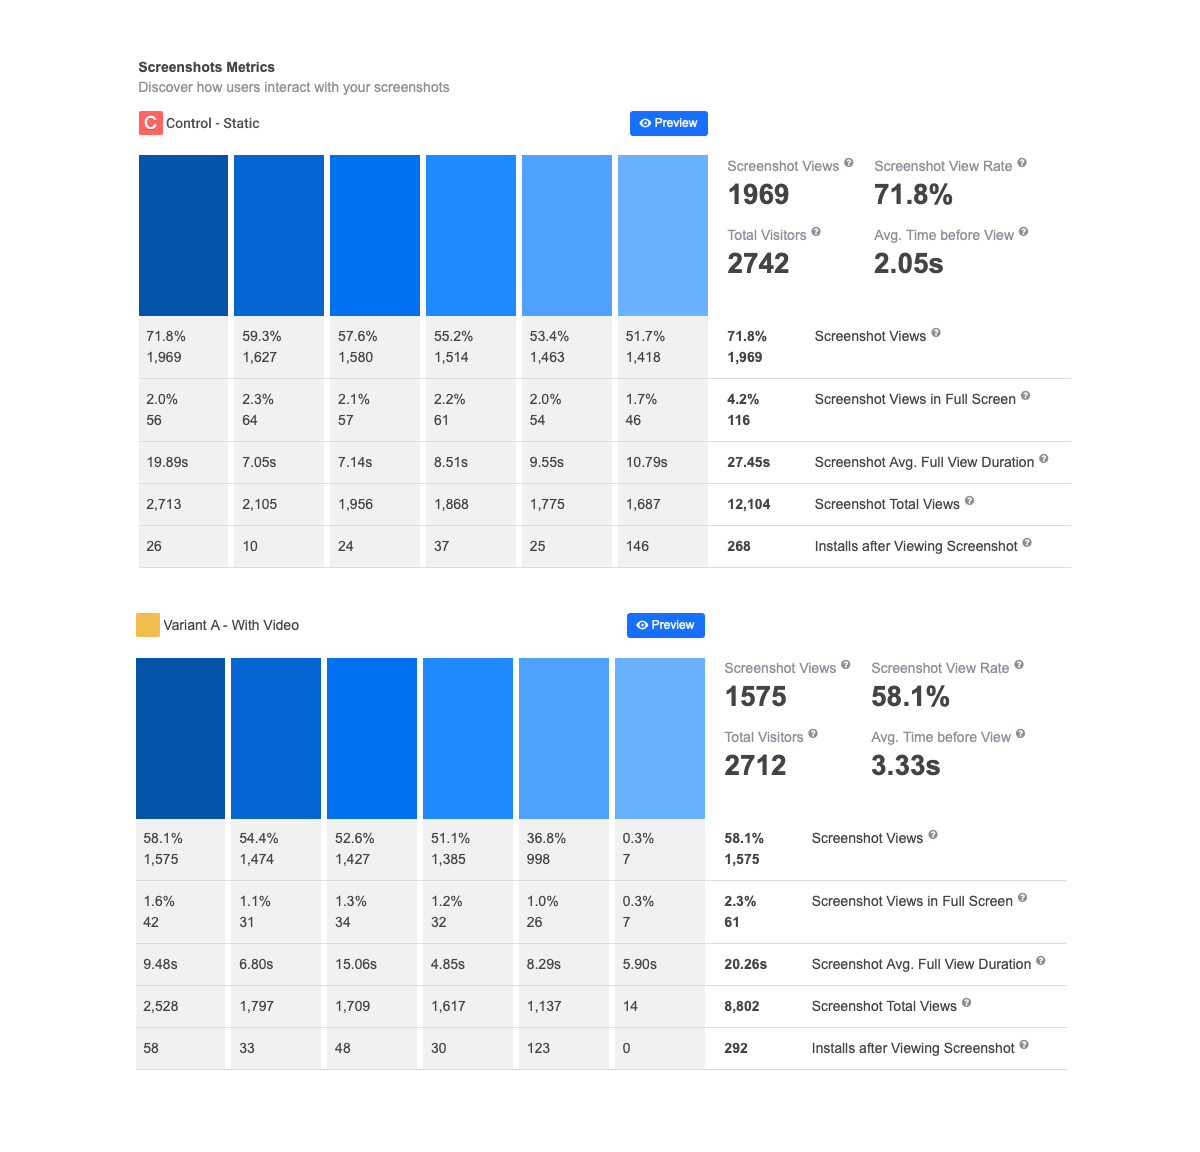
Control variation: Screenshot Views start at 71.8% (meaning the rest of the visitors installed the app directly or bounced) and slowly decreases down to 51.7% which is a good rate for the last screenshot.
Variation A: Screenshot Views start at 58.1% for the first screenshot. Remember that it goes after the video, so technically it takes the second position in the gallery of visuals.
Overall, this variation underperforms in terms of Screenshot Views compared to the control variation, but let’s look at Installs after Viewing Screenshots.
Installs after Viewing Screenshot:
Obviously, Variation A performs better in terms of installs, which is an argument in favor of the variation with the video.
We’ll see the metrics around the video further down. But before we do that, have a look at Screenshot Views for screenshots 4 and 5. There’s a drop in the metric for variation A, and the last screenshot has no installs whatsoever. In follow-up A/B tests, it makes sense to leave out the last two screenshots and try A/B testing the Control against the variation with the video plus 4 screenshots.
Now let’s dig into the analytics of the video in the App Video Preview tab of the platform.
What is the reason? Is it the video that goes before Variation A screenshots? At this point, we are going to check the performance of screenshots (the “Screenshots” tab), and as they are identical across the two variations, we’re going to check the random factor.
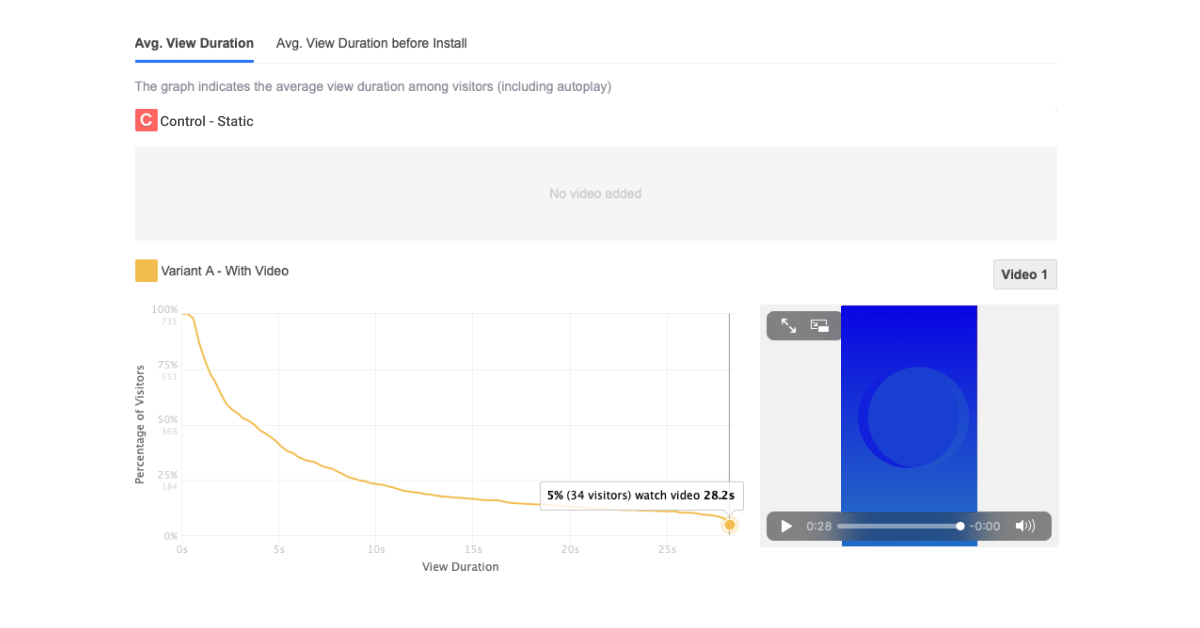
The duration of the video is 28 seconds, while only 5% of the visitors watched it till the end. According to our benchmarks, product page visitors watch videos for 10-12 seconds. This particular video is no exception – its Avg. View Duration is 12 seconds:
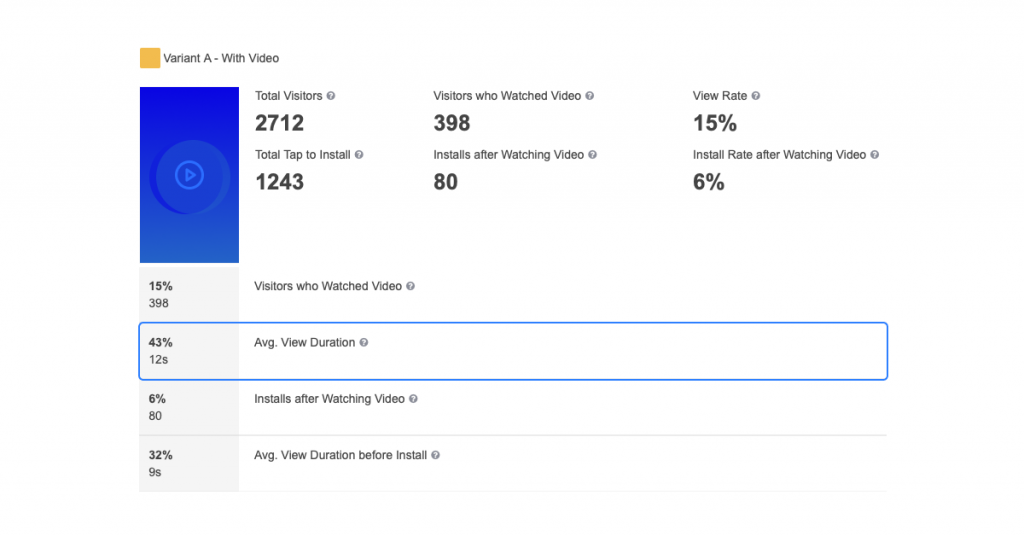
It’s likely that such a long video makes people bounce from the app page and that’s why fewer visitors view further screenshots. For follow-up A/B tests, it makes sense to try a video half as short as this one and see how it performs.
There’s another valuable insight that we can get from the A/B testing statistics above: Avg. View Duration before Install is 9 seconds, meaning that in the following iteration of the video design you might want to put the most valuable information about the app into the first 9 seconds.
Installs after Watching Video is 6%, while Installs after Screenshot Scroll are 9.8% and 10.8% for the two variations. These data show that the video contents has to be reconsidered: the features shown in a video shouldn’t be repeated on further screenshots. Use the valuable space to showcase your app without duplicating its features.
Keep in mind that the analysis outlined above is only an example of how the insights can be obtained from the no winner A/B experiments, and this workflow is not necessarily relevant to your app.
To sum it up, at first sight A/B tests without a winner may disappoint you as you don’t get the answer – which variation converts better. However, A/B experiments are not about the conversion data only. As they run, they collect priceless stats and insights for you to run further A/B tests that will result in a winning variation.