Graphic Visualization of Your Apple Ads Performance
 Liza Knotko
Liza Knotko
Liza Knotko 
The SearchAdsHQ team is happy and proud to announce the introduction of charts within our platform for management and optimization of Apple Ads. The charts are all about dynamics in metrics over time and data analysis. They favor the discovery of trends, patterns, spikes, drop-offs and metrics correlations.
In general, charts is a powerful way of information representation which makes it easier to compare different data and numbers. A survey by Aberdeen Group found that managers that rely on visualized data along with dashboards and reporting are 28% more likely to gain relevant insights.
In the context of Apple Ads, metrics visualization assists in more efficient assessment of App Store ads performance fluctuations which in its turn streamlines your decision-making process.
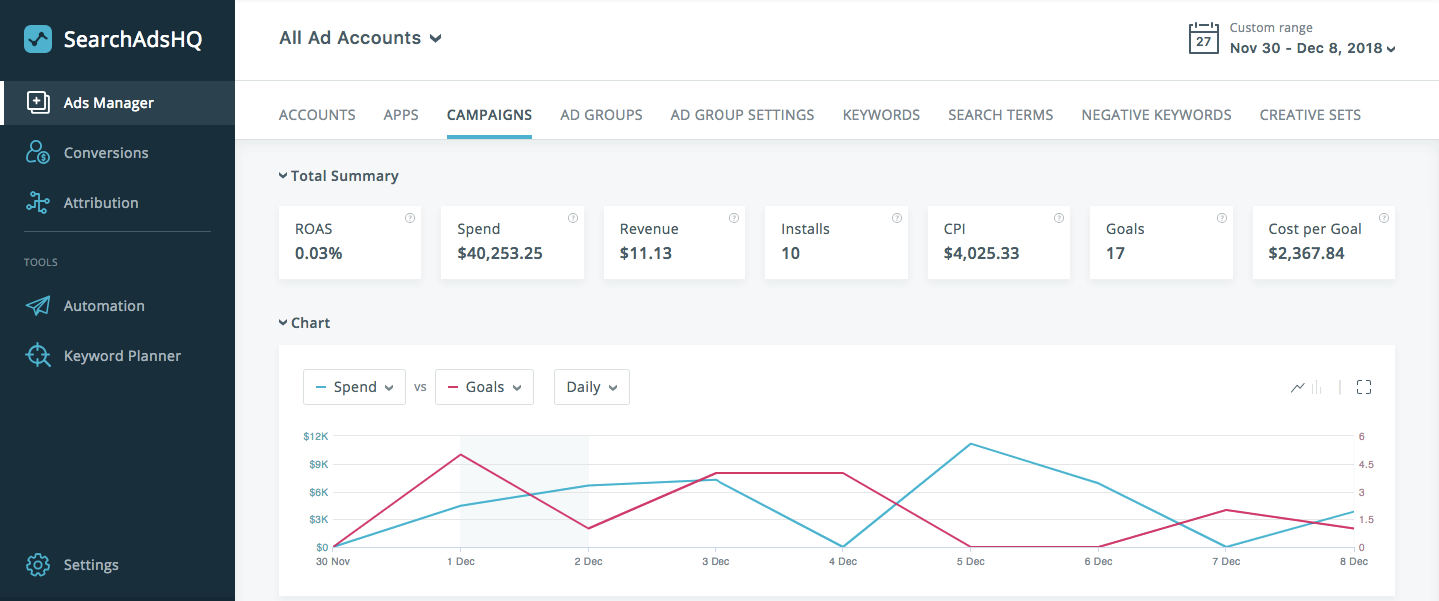
The best part about SearchAdsHQ charts is that they graphically illustrate fluctuations of all metrics over time. Thus, Apple Ads managers are able to note some trends and data patterns and optimize their App Store ads accordingly.
SearchAdsHQ charts help to:
Now every SearchAdsHQ dashboard contains charts on all its levels so you don’t have to switch between various tabs or open millions of new ones in your browser to compare data.
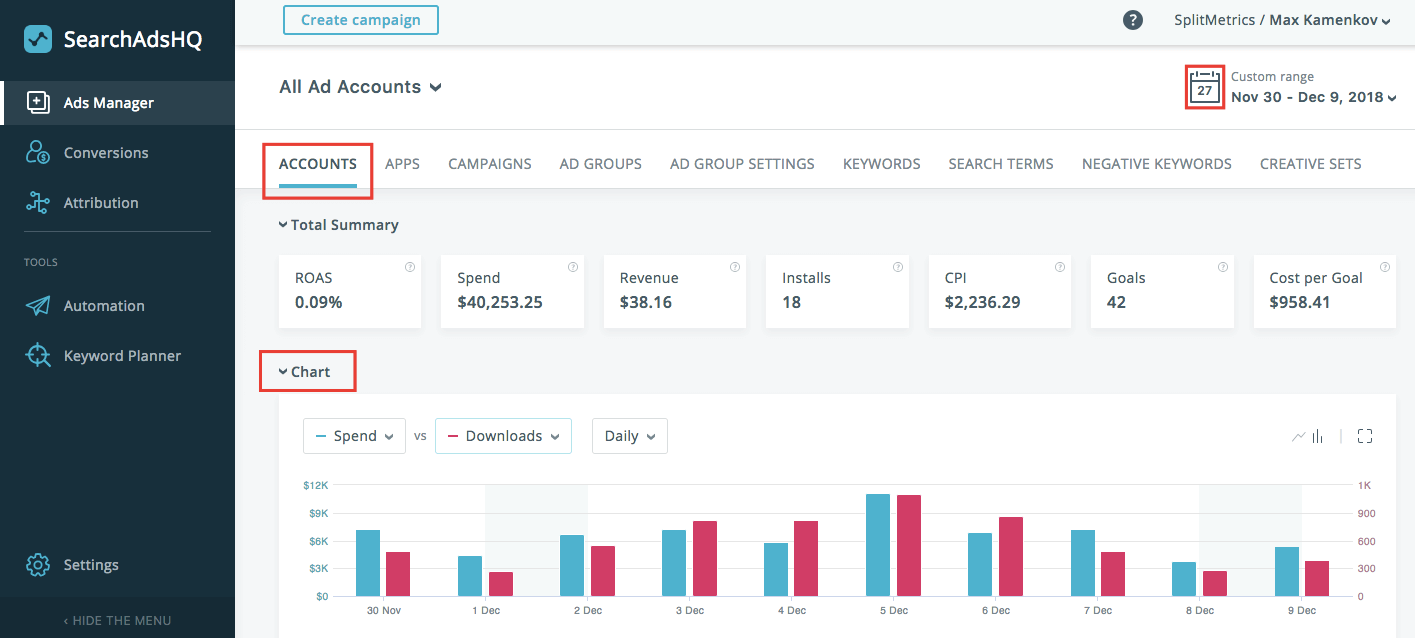
You can find the table with data and a chart right above it at the following levels:
You can also use the calendar in the upper right corner to change the time period under analysis. If you apply filters in the table below it will be reflected in the chart as well.
The charts can be expanded if necessary. It’s also possible to hide charts when you don’t need them.
To make it easier to uncover consistent patterns, the SearchAdsHQ team made it possible to reflect one or two metrics within a chart. Furthermore, you can choose from all performance metrics from the dashboard (Spend, ROAS, Revenue, Impressions, Taps, Downloads, Install, All Conversion, Goals, etc.).
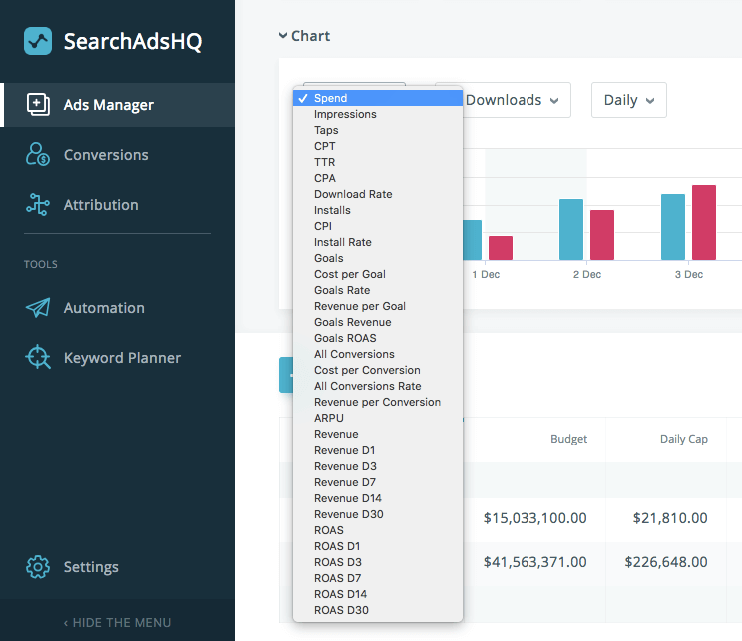
You can also see trends in Cohorts metrics (ROAS D3, ROAS D7, ROASD14, ROAS D31, Revenue D3, Revenue D7, Revenue D14, Revenue D31). These metrics provide insights into keywords performance over a certain time period. What concerns the group/campaign level, cohorts let you understand your performance trends in the context of the goals you’ve set. However, mind that metrics like Budget, Bid, Daily cap, etc. don’t belong to statistical ones, they represent attributes and can’t be reflected in SearchAdsHQ charts.
What concerns charts granularity of data display, SearchAdsHQ provides the following options:
SearchAdsHQ users also can adapt the way the charts are represented on their dashboards. All it takes is choosing the most convenient option between:
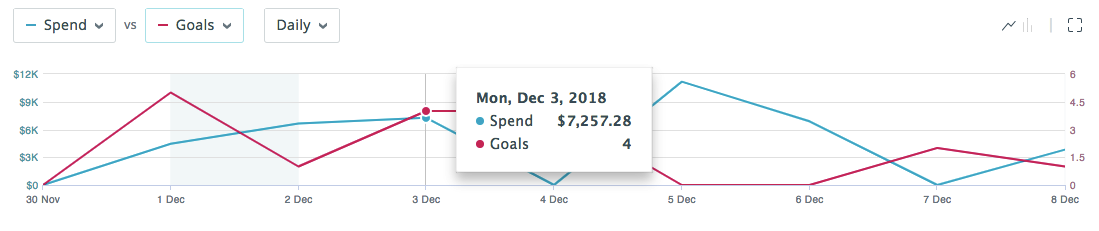
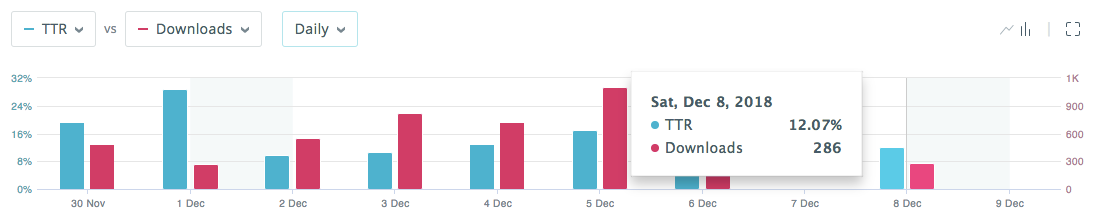
The operation principle of SearchAdsHQ charts is similar to the one you can find in the Apple Ads dashboard. However, SearchAdsHQ provides more detailed statistics and gives more room for App Store ads management maneuvers.
Above all, SearchAdsHQ covers statistics on metrics from all stages of an acquisition funnel – from such Apple Ads metrics as Spend, Impressions, Taps, Downloads, etc. to data on in-app events (Install, Goals, etc.). Thus, you can correlate more metrics and note more insightful patterns and trends.
Thanks to smooth navigation and flexible filters SearchAdsHQ provides, users can take different segments of their ad account (for example, only high performing keywords) and analyze any metric on this particular segment with help of charts.
And finally, SearchAdsHQ charts are the part of the main dashboard. It means you can not only analyze some metrics but also have instant access to management. It saves time and increases convenience immensely.
The introduction of SearchAdsHQ charts is an important step to making the representation of all App Store ads related metrics more graphic and evident. It’s yet another tool to empower your Apple Ads and earn more doing less.