How to Design & Run Valid A/B tests: the SplitMetrics Framework
 Gabriel Kuriata
Gabriel Kuriata
Gabriel Kuriata 
For mobile apps, a valid A/B test is a data-driven experiment that ensures the measured difference between the control (A) and the variation (B) is genuinely caused by the change you made, and not by chance, bias, or external factors. Validity in A/B testing for mobile is achieved through adhering to strict statistical and methodological criteria and designing tests properly.
Statistical and methodological criteria are easily maintained with the help of proper A/B testing tools, such as SplitMetrics Optimize, our A/B testing platform for app product pages on mobile app stores. Luckily, choosing the correct creative elements to test is fairly straightforward, provided we follow a proper framework.
This article elaborates on the official A/B testing & validation framework developed by SplitMetrics, enabling users to utilize our platform to its fullest potential and design tests that have the highest chance of providing meaningful, actionable results. If not in the form of new winning variations, then in lessons learned that will point our design in the right direction.
Scale determines how hard a failure hits. Today, with millions of apps on the market and thousands of new ones joining the crowd every day, any form of success requires significant investment. Not only in development but also in marketing. With marketing budgets for casual games frequently being in the seven-figure-a-month category, a failure hits their publishers like a freight train.
Good apps with great features aren’t immune to failure. Great apps can underperform because of their product pages. Customer expectations change. Entire genres come, go, and return from beyond to app stores. Jumping on the gravy train is much more difficult than it sounds. Are match-3 games all the rage now, or are they being replaced by match-4 games? Sometimes it’s difficult to tell.
With a great scale of operations comes great responsibility. For big projects testing is ingrained in the development process and ubiquitous among successful mobile app developers. Many factors contribute to the app’s potential for profit – or loss and testing provides considerable control over many of them. It can directly influence installation, drop off and engagement rates. It also has an implicit impact on lifetime value, revenue and in-app purchases. For smaller projects testing can also be a life-saver as strained budgets leave less room for error. The most important point is: A/B testing can be outstandingly beneficial to each and all developers and publishers, but it’s a case by case analysis. A good framework and experience helps to maximize our return on this investment. This is why we’re always ready to help and assist in many projects.
So, if the investment in testing your app looks sensible to you, let’s get down to the subject matter.
Our official testing and validation framework consists of eight steps. It doesn’t matter what stage of development your app is; the framework remains the same:
We rigorously follow this framework for apps at all stages of development, simply shifting our focus to the elements that matter during each stage. The focus of SplitMetrics Optimize and what we do in the Agency is testing & validation of mobile app product pages on app stores. Given that, our framework serves different purposes depending on the stage of development an app is in:
To answer a frequently asked question in advance: yes, it’s possible to conduct meaningful experiments and tests even when your app is nothing more than some ideas on paper (or rather, concept screens). We have the tools in SplitMetrics Optimize to test that, and they’re used more frequently than you might think!
Anyway, in this article, we give examples of successful validations for apps in all the mentioned stages of development, so let’s get right into it.
Your app will have to beat thousands of other apps to… win a couple of seconds of attention from a user. In that time, you’ll have to convince them that your app is worth installing. The research step is a solid foundation to answering the question of “How to hell do we do that?”, provided it consists of these elements:
But how do you actually start your research? The first step in this process is to check if someone hasn’t done it already.
Otherwise, this stage can be time-consuming (but at the same time incredibly fun). You want to do this (or have to) phase all by yourself? Here is a checklist for each part of the research phase:
This might be the most difficult part for an individual publisher, as a key component here are industry benchmarks that are a reflection of the current state of the market. Average values of tap-through rates, conversion rates, and other metrics are difficult to acquire without a large portfolio of clients (that an agency or a company like ours might have) and a history of test & experiments, so most probably you’ll just HAVE to rely on external sources to evaluate the feasibility of creating an app for a particular category and audience.
Another key component is keywords. These directly reflect the functionality of apps and the users’ intent. It isn’t easy to evaluate their competitiveness and popularity without proper tools, although in theory, the Apple App Store and Google Play Store offer what’s necessary to accomplish this task.
Another area to examine is the physical number of similar apps on the app store. So… to answer the question of “How many match-3 games are out there exactly?”… someone has to count them. It truly matters for the next question: “How do we add another one that is successful?”. You won’t know that without…
You should conduct competitor analysis on two levels: macro and individual apps. Take a population of apps most similar to yours and try to distinguish any trends & patterns in design and messaging. Take a sample of the most successful apps and study them individually.
This part will help you formulate your value proposition during the Ideation phase. Either offer something new (a unique feature), perfect what’s already out there (better performance)… or find yet another way.
This article on ASO competitive research may be helpful in understanding this step better.
Audience analysis: this part may require some investment in probing ad campaigns to verify responsiveness to ad groups organized by key demographic metrics. You may complete this step later, as discovering your audience can be a result of using our testing framework. This is precisely what our client Etermax did with their quiz app.
You can also make assumptions based on market research and competitor analysis, as it’s possible to deduce through creatives which apps most similar to yours are targeting.
This is what you should have after completing this step:
With these at hand, you’re ready for the next step.
In this phase, you collect ideas for all the things that you’ll want to test. These can be key features (highlighted through app store creatives), artistic direction, screenshot types, icons. What’s on the table depends on the development stage you’re in.
We would like to start with big, different concepts at first – to really understand what is the core motivation of the users. What is the reason for them to download the app, which USP would speak to the majority of the audience? Once we know the core motivation and we find a winner – we keep testing and optimizing in a fine tuning process.
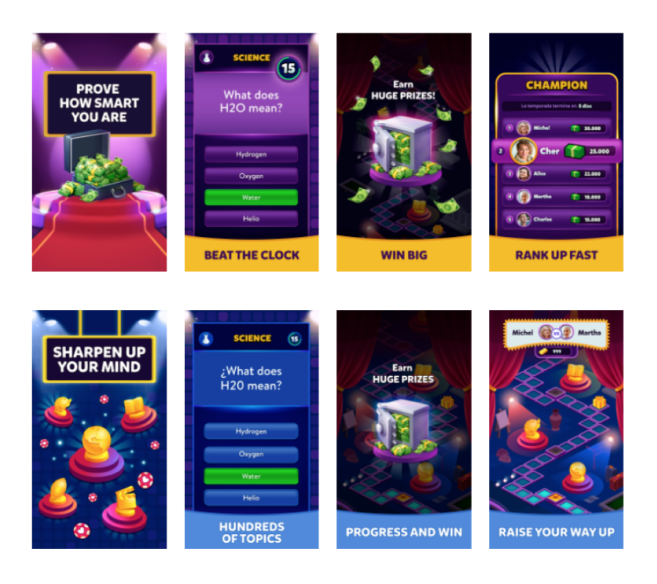
To illustrate this step with a real example, consider the case of Etermax. Following the success of Trivia Crack, Etermax was developing a new Trivia game, targeting a more senior audience. What value can the app bring to its intended audience?
We had a new Trivia game in development, aimed at a more senior audience. We wanted to know before the release of the game what type of users we were targeting. With the product team, we set up 2 user archetypes.
The two archetypes were:
Both ideated archetypes are valid and have potential. However, given their mutual exclusion and overall impact on messaging present on the app’s product page on the App Store, as well as in-game design, there was only room for one.
In this stage, you use your ideas to form hypotheses that can be verified and tested. What is a hypothesis? Well, essentially, it’s an educated guess that discusses variables that can be verified. How you formulate your hypothesis determines the design and execution of your validation later.
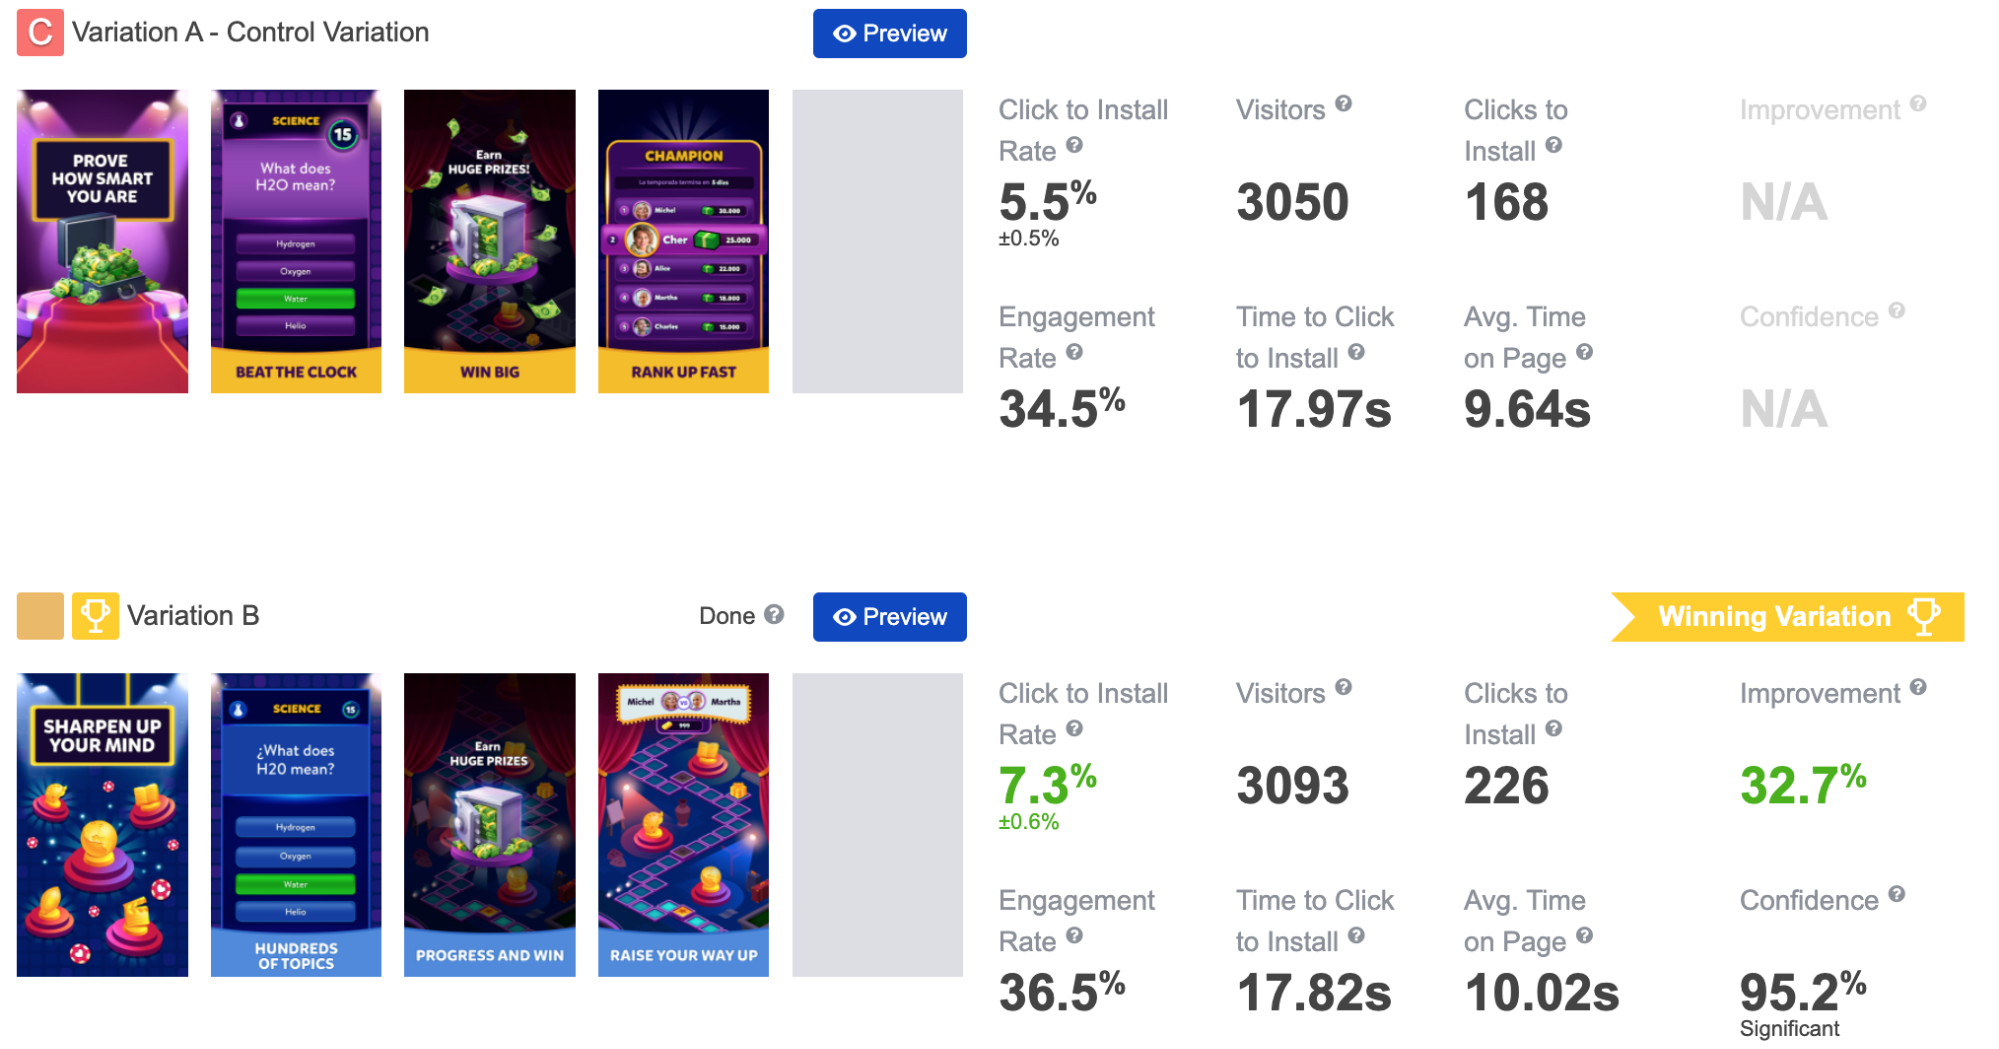
Let’s get back to our Etermax case. We have two big ideas:

The hypothesis: the senior audience might prefer a more casual game that promises self-improvement and sharpening of their skills and intellect.
It’s not uncommon to see A/B tests run this early in the development cycle. Read the full Etermax case study to see how pre-launch testing can work. We also recommend this article, which explains why it’s actually very beneficial to start testing even before the release.
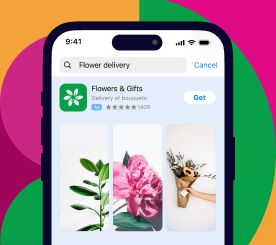
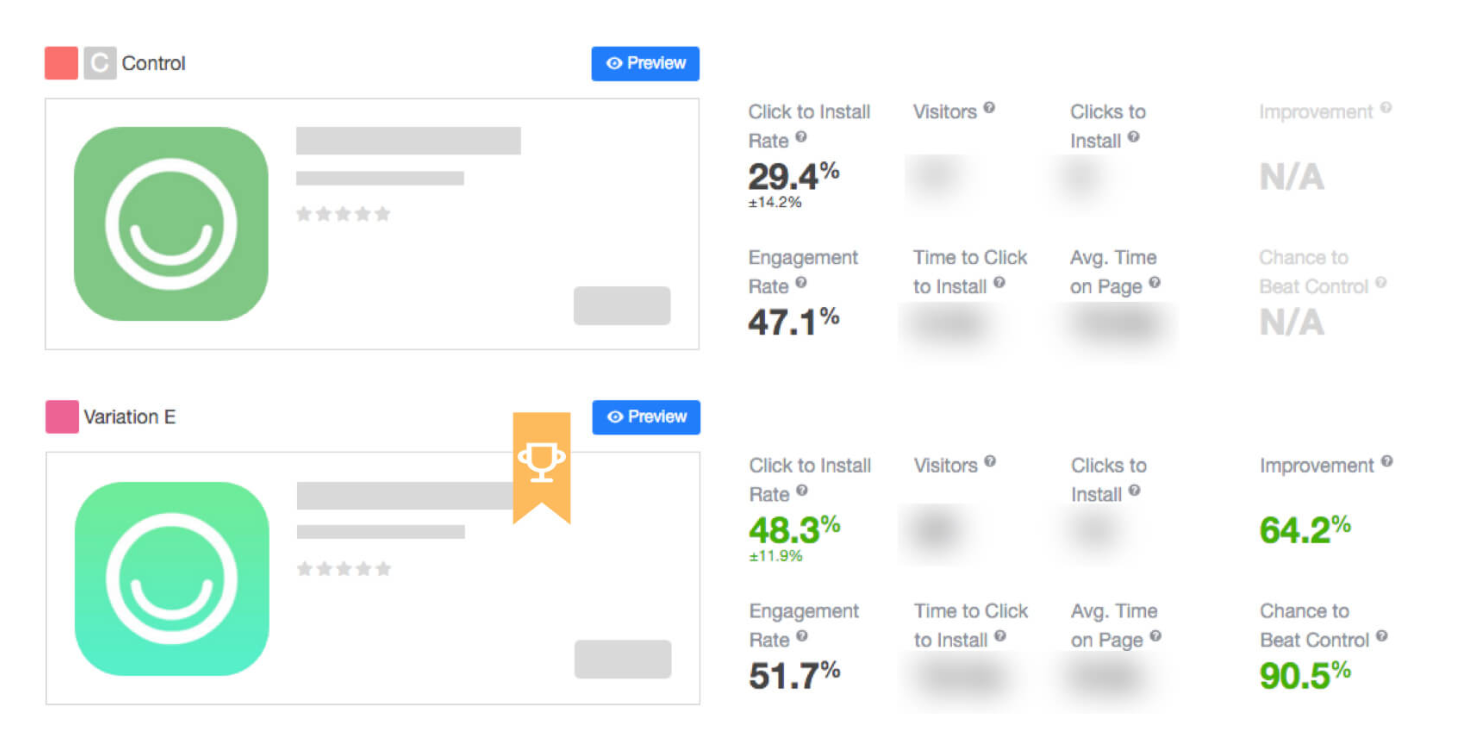
Another example is the case of Hobnob and rebranding that led to a decrease in conversions and tap-through rate. Hobnob is the app that helps people create professional-looking event invitations and distribute them via text messages. Which element of the app’s product page may affect those metrics?
The hypothesis: app icon is the only graphic asset that’s shown in both the search results and on the product page. Changing it will improve both tap-through rates and conversion rates.
We recommend a top-down approach in this stage. Your first hypothesis should discuss variables (in our case, product page creatives) with biggest visibility and possible impact on users. The app’s icon, the first screenshot – visuals responsible for the very first impression. You’ll have the opportunity to go deeper in future experiments. The best strategy is to test your changes one by one, to achieve clear and transparent analytics.
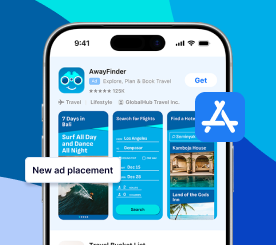
Transform your hypotheses into variations for testing. How? Look at the screen below:
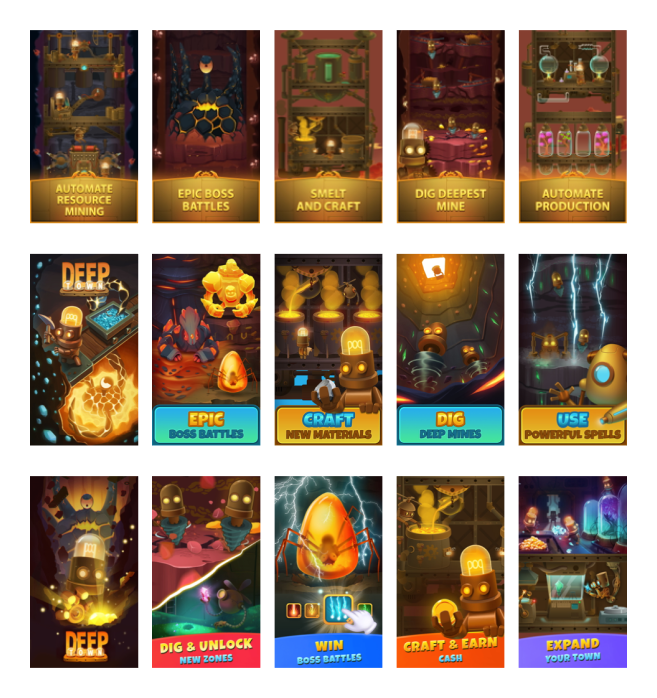
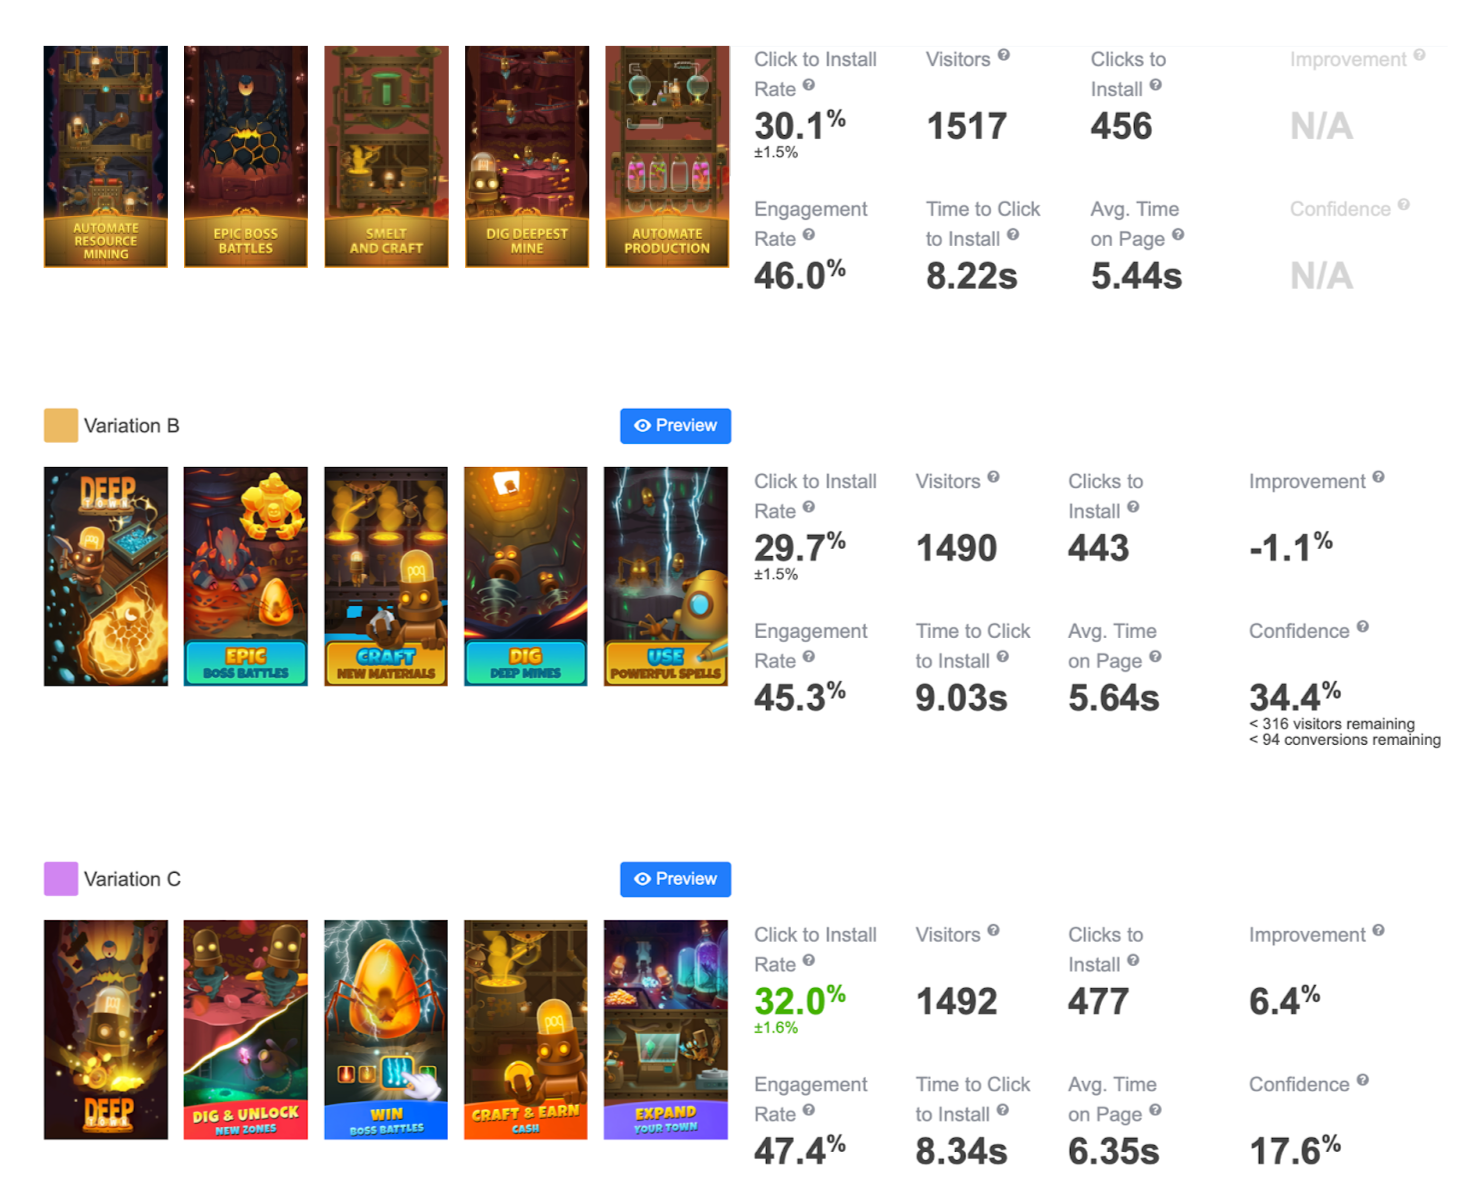
Another fine example of a proper selection of screenshots for testing is the case of Rockbite and Mining Idle Tycoon:
In this step, we’re diving into all the nitty-gritty details. This is the step when our designs and image sets are sent from the design team and into our SplitMetrics Optimize platform.
Designing & executing an experiment involves these steps:
Remember, compare what’s comparable. Traffic from Facebook campaigns differs in quality from that acquired through Apple Ads. Be prepared that the results may be inconclusive, so you can begin another test immediately.
All in all, our platform greatly simplifies this step.
So how did our tests fare? Let’s have a look at a result from SplitMetrics Optimize:
All cases shown above have well-planned-out tests that resulted in decisive results for winning variations. This isn’t always the case. Basically, we can have 3 possible outcomes for each executed experiment:
Sharing what you know with others can have a significant impact not only on your project but also on others. Your research and preparation can be a valuable lesson for other teams. Transparency ensures that stakeholders have proper expectations regarding future projects. An internal knowledge base can significantly reduce the workload required for future validation processes.
As soon as you have decisive results, implement and observe changes in metrics. Don’t stop testing, don’t stop growing.
Seasonality also plays a role in maintaining the continuity of A/B testing of mobile apps. You can significantly boost your results by customizing your app store presence to summer holidays, Christmas, or any other local festive period. The gains can be so significant that they warrant earlier preparation.
Trends change, user expectations evolve, and so should your app. As long as the benefits of maintaining an app outweigh the cost of validating & improving it, you should continue to seek out new opportunities for growth.