Paid UA in 2022: Apple Ads Costs, Trends and Insights
 Lina Danilchik
  Lina Danilchik
 How to make your mobile app visible on the App Store, among the millions of other apps fighting for a place in the sun? Along with ASO, Apple Ads is a solution that is designed to meet this challenge.
SplitMetrics Acquire by SplitMetrics, an Apple Ads Partner, analyzed how this ad channel performed in the second half of 2021 across 15 app categories and 61 regions, and introduced the results in Apple Ads Benchmarks Report. The report is based on the aggregate data from mobile apps that use SplitMetrics Acquire, SplitMetrics’ product for Apple Ads automated management and optimization.
In this report, the average performance (TTR and CR), and cost metrics (CPT and CPA) in Apple Ads are presented for popular app categories and countries.
Here are a few insights from the report that might help you streamline your paid UA strategy for 2022.
Average CR experienced growth and reached an impressive 62.22% (compared to 50%, the average provided by Apple Ads).
We can clearly see a growth trend, which may be due to the highly motivated users of this ad placement who see apps they are looking for on top of search results. Additionally, according to Singular, Apple Ads became the fastest-growing ad network in 2021. The more effort mobile marketers put into this channel, the more users get involved and download apps they see when searching for something specific.
Also, all analyzed markets had a conversion rate higher than the Apple Ads’ average during H2 2021. More details and graphs can be found in the report.
The average CPT was $2.22.
Finance market continues to boom. CPT for Finance in H2 2021 was more than 5 times higher ($11.73) than the average one.
Such an unconditionally high CPT might be related to cryptocurrency and trading apps that warm up the market.
We are seeing a seismic shift in how people manage their money online nowadays. Gone are the days when investing was for a select, wealthy few. Now, because fintech apps have significantly lowered the bar to entry, more and more people are taking direct control of their finances.
Additionally, if you compare the rising CPT also with the rising Bitcoin prices (reaching a new all-time high in November 2022) you will see quite an overlap.
More interest in the market leads to more search traffic in the app stores for those apps, which leads to higher prices if you want to be at position number one.
Except for Games, other 13 categories had CPT lower than the average value, so Finance strongly influenced the average CPT across all categories.
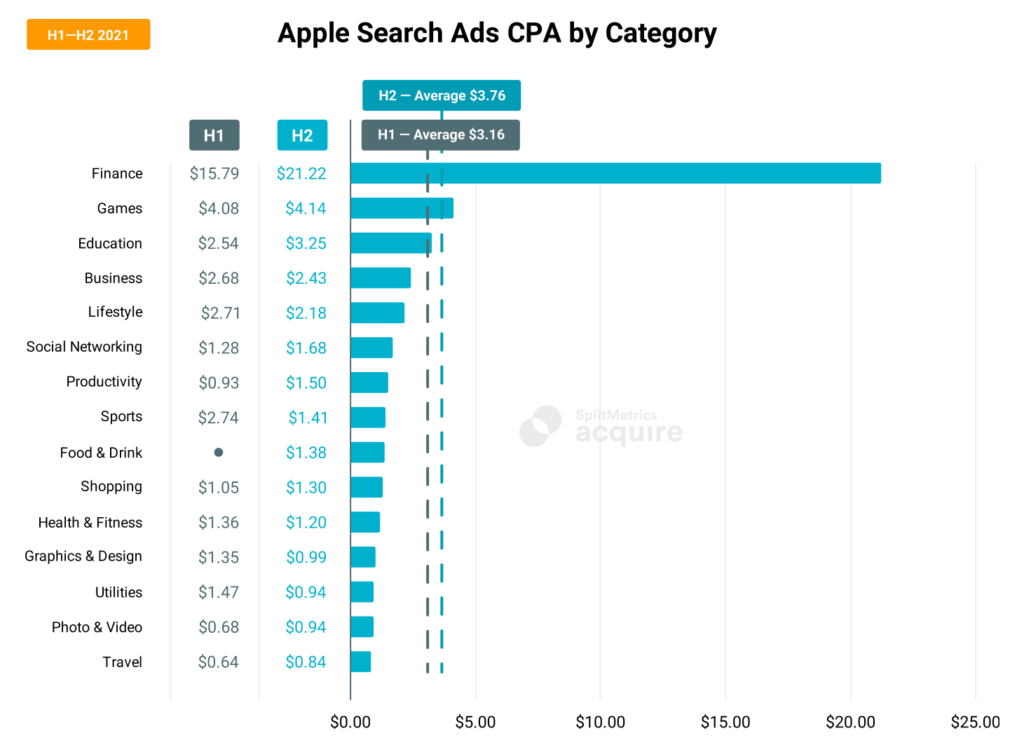
The average CPA amounted to $3.76. In the first half of 2021 it was $3.16, so we can see a slight increase.
CPA for Finance also affected the average CPA for other categories and amounted to an unprecedented $21.22, 5.6 times higher than the overall average.

Cost seasonality: in September both CPT and CPA decreased when people went on holiday during the velvet season, while others prepared to feed into the work mode after vacationing. Starting from this point, costs are growing, peaking in November when everyone was preparing for holiday campaigns and striving to reach their target KPIs before the end of the calendar year.
The US, Canada, Australia and Great Britain remained the most competitive countries in terms of CPA and CPT.
They occupied the first 4 positions with the following order: the US ($5.37), Great Britain ($4.34), Australia ($3.97) and Canada ($3.76). Apart from these leaders, only one country had a CPA higher than the average value ($3.44) – Japan ($3.57).
I believe that most Apple Ads marketers by now use the possibility to combine the English-speaking countries in one campaign group if they operate in those markets and want to drive UA there. Especially for US and UK keyword-level CPTs usually increased or decreased at the same time.
CPA fluctuations reflected those in CPA across categories and followed the seasonal trends. For most markets, except for China, the highest CPA rates were observed in December, while CPA of the US, Canada, and Puerto Rico boomed in November with an incredible $7.21. The spikes in CPA at the height of the holiday season is related to specific campaigns run before Thanksgiving and Christmas.
To get more insights and make data-driven decisions when it comes to the overall mobile marketing strategy, you may download the full Apple Ads Benchmarks Report. This will enable you to get a better understanding of current trends in your niche and target markets, compare the performance of your apps to the industry averages, and identify points of growth.

