Apple Ads Benchmarks 2019 by 16 App Store Categories
 Anastasia Sidoryk
Anastasia Sidoryk
Anastasia Sidoryk 
There are approximately 2 million apps out there on the App Store. Visibility and discoverability in this huge ocean of apps may be quite a challenge for app marketers.
Apple Ads has emerged as a tool to reach out to potential highly motivated users at the exact moment they do the app searching. Apple claims remarkable performance of its paid network: a 50% average conversion rate and a 65% download rate that results from a search on the App Store.
But how does Apple Ads cope with user acquisition in practice? To get the real picture, we’ve researched the accounts linked to our SearchAdsHQ platform.
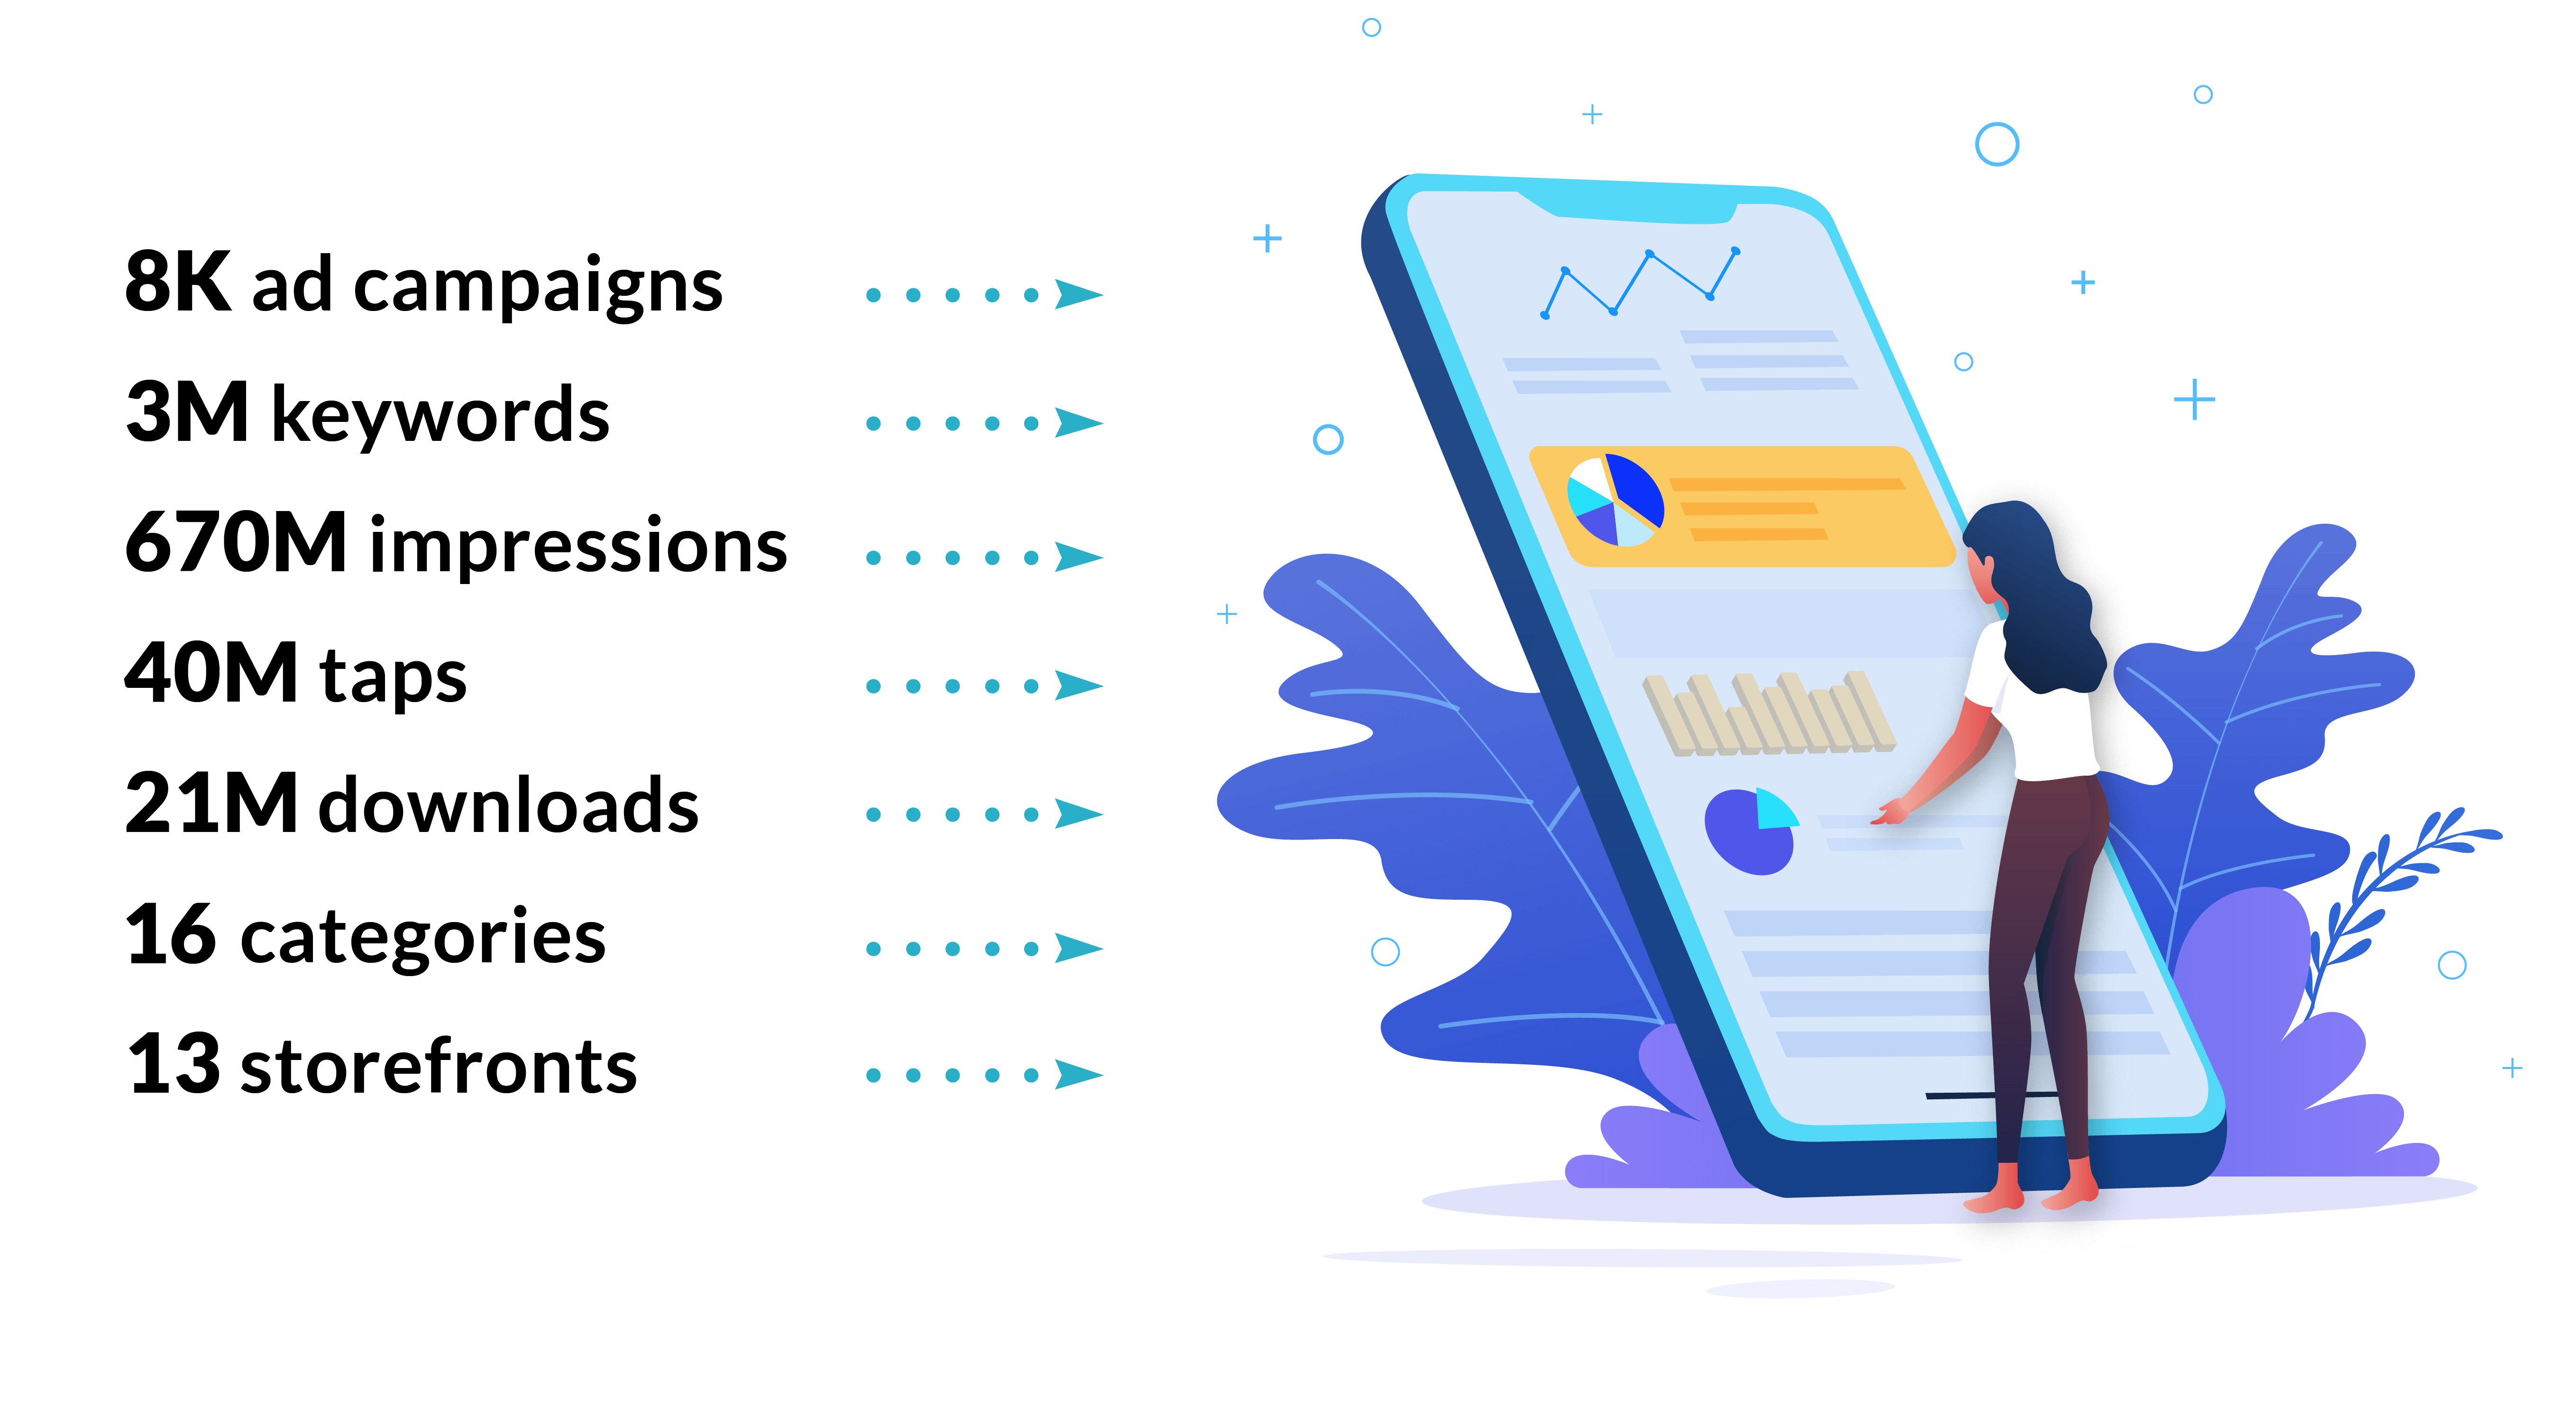
The benchmarks below are based on the data obtained from July 2018 to February 2019:
In this article, you will find the 2019 Tap-through and Conversion Rates, as well as average Cost per Tap and Cost per Acquisition by 16 App Store categories. We’ve also compared them with Apple Ads benchmarks 2018, Apple app store search ads cost and with the benchmarks from other advertising networks.
Leverage SplitMetrics’ Apple Ads Benchmark Dashboard to assess the most recent averages – all key metrics at one place, and don’t bother looking for them anywhere else. You have everything to assess your ad performance and improve it if necessary.
Before you delve into the report, here are our findings in short:
1. The average Apple Ads TTR across App Store categories – around 6.06% – is about 1% smaller than last year, which points at the strengthened resistance of users to ads. In comparison to Facebook and Google Ads, Apple’s advertising network boasts a higher Tap-through rate.
2. Our research has revealed the average Сonversion Rate of 49.69%, with the highest rates in the Lifestyle (66.24%), Music (64.27%) and Photo & Video (56.32%) categories. Such conversion rates result from highly motivated users that come to the App Store to search for apps.
3. Think about app page optimization, because it turns out that high TTR doesn’t necessarily mean high Conversion Rate.
4. The average CPT across 16 App Store categories is approximately $0.95, which is greater than last year ($0.84). The most expensive categories are Sports ($4.16) and Finance ($3.73).
5. The average Apple Ads CPA is around $1.90, which exceeds last year’s average of $1.76, probably due to the fact that the market gets more mature. The most expensive App Store categories in terms of Cost per Acquisition are Finance ($10.33) and Sports ($8.14).
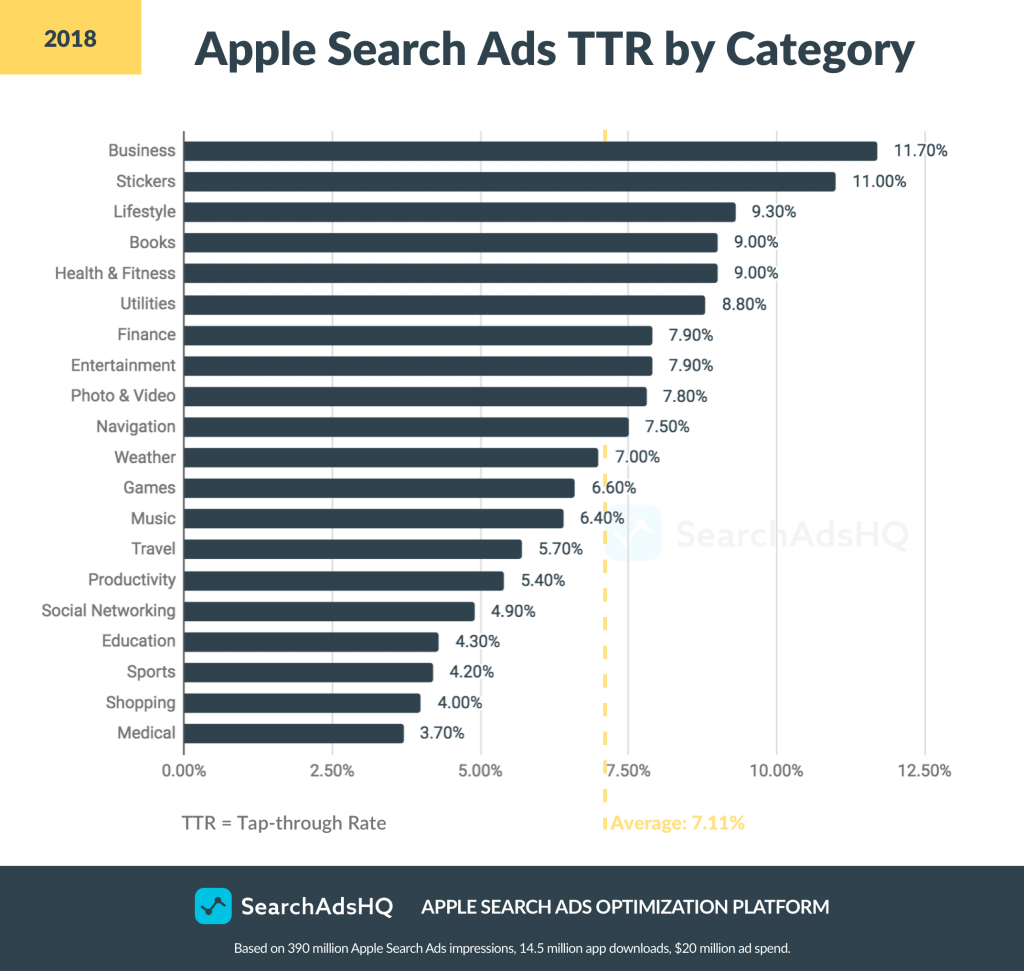
Our team has made research to reveal that the current average TTR on Apple Ads is about 6.06%. Compare: last year the average conversion rate from impressions to taps hovered around 7.11%.
The decrease in the TTR average by approximately 1% suggests that the audience becomes more immune to promoted apps. Instead of tapping on a blue-tinted ad, they tend to focus on organic search results.
Is the TTR of 6.06% poor or healthy? To figure it out, let’s compare Apple Ads conversion from impressions to taps with the same benchmarks for other mobile app ad channels.
In the chart below we’ve compared Tap/Click-through rate averages for AppleSearch Ads and the two most popular advertising networks – Google Ads and Facebook. The data are taken from the Paid Media Benchmark Report Q4 2018 made up AdStage:
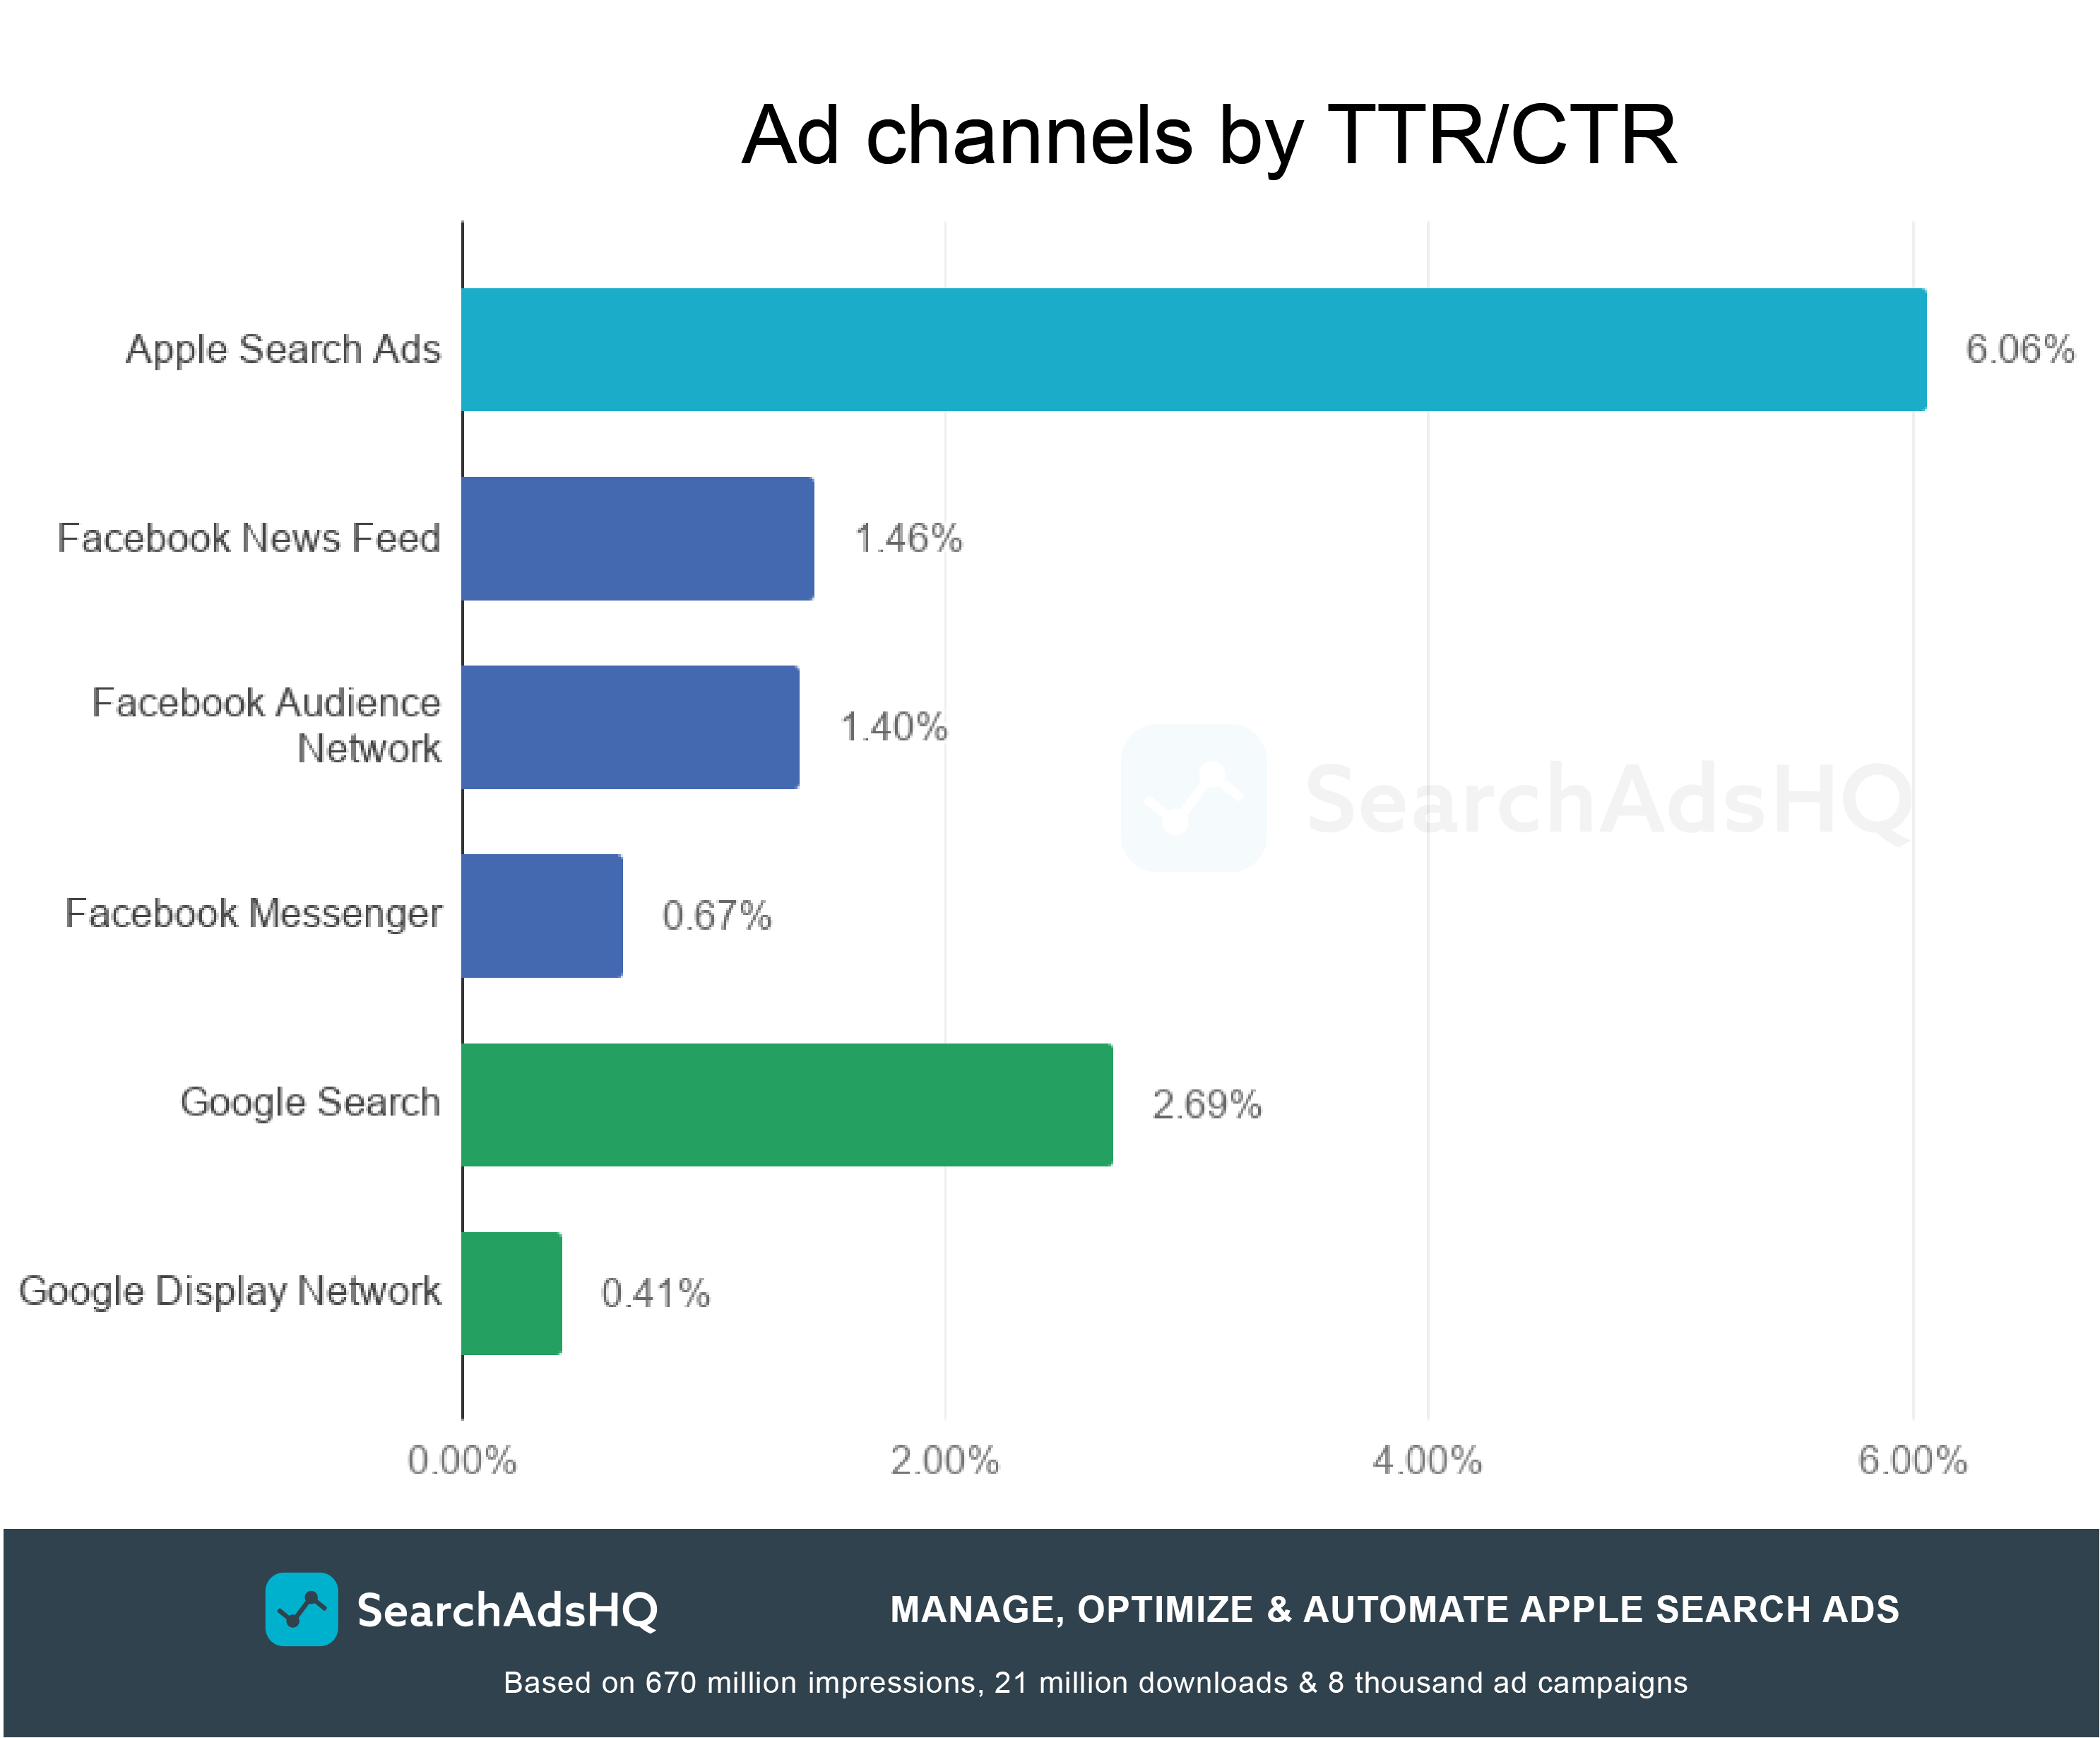
It’s vital to make a quick point here: while Apple Ads is used exclusively to promote apps, Google Ads and Facebook embrace a vast majority of campaign types, including but not limited to app campaigns.
It turns out that Apple Ads is the most high-performing advertising network in terms of conversion from impressions to taps (clicks). The runner up is Google Search, but it lags well behind, which makes Apple Ads worth trying.
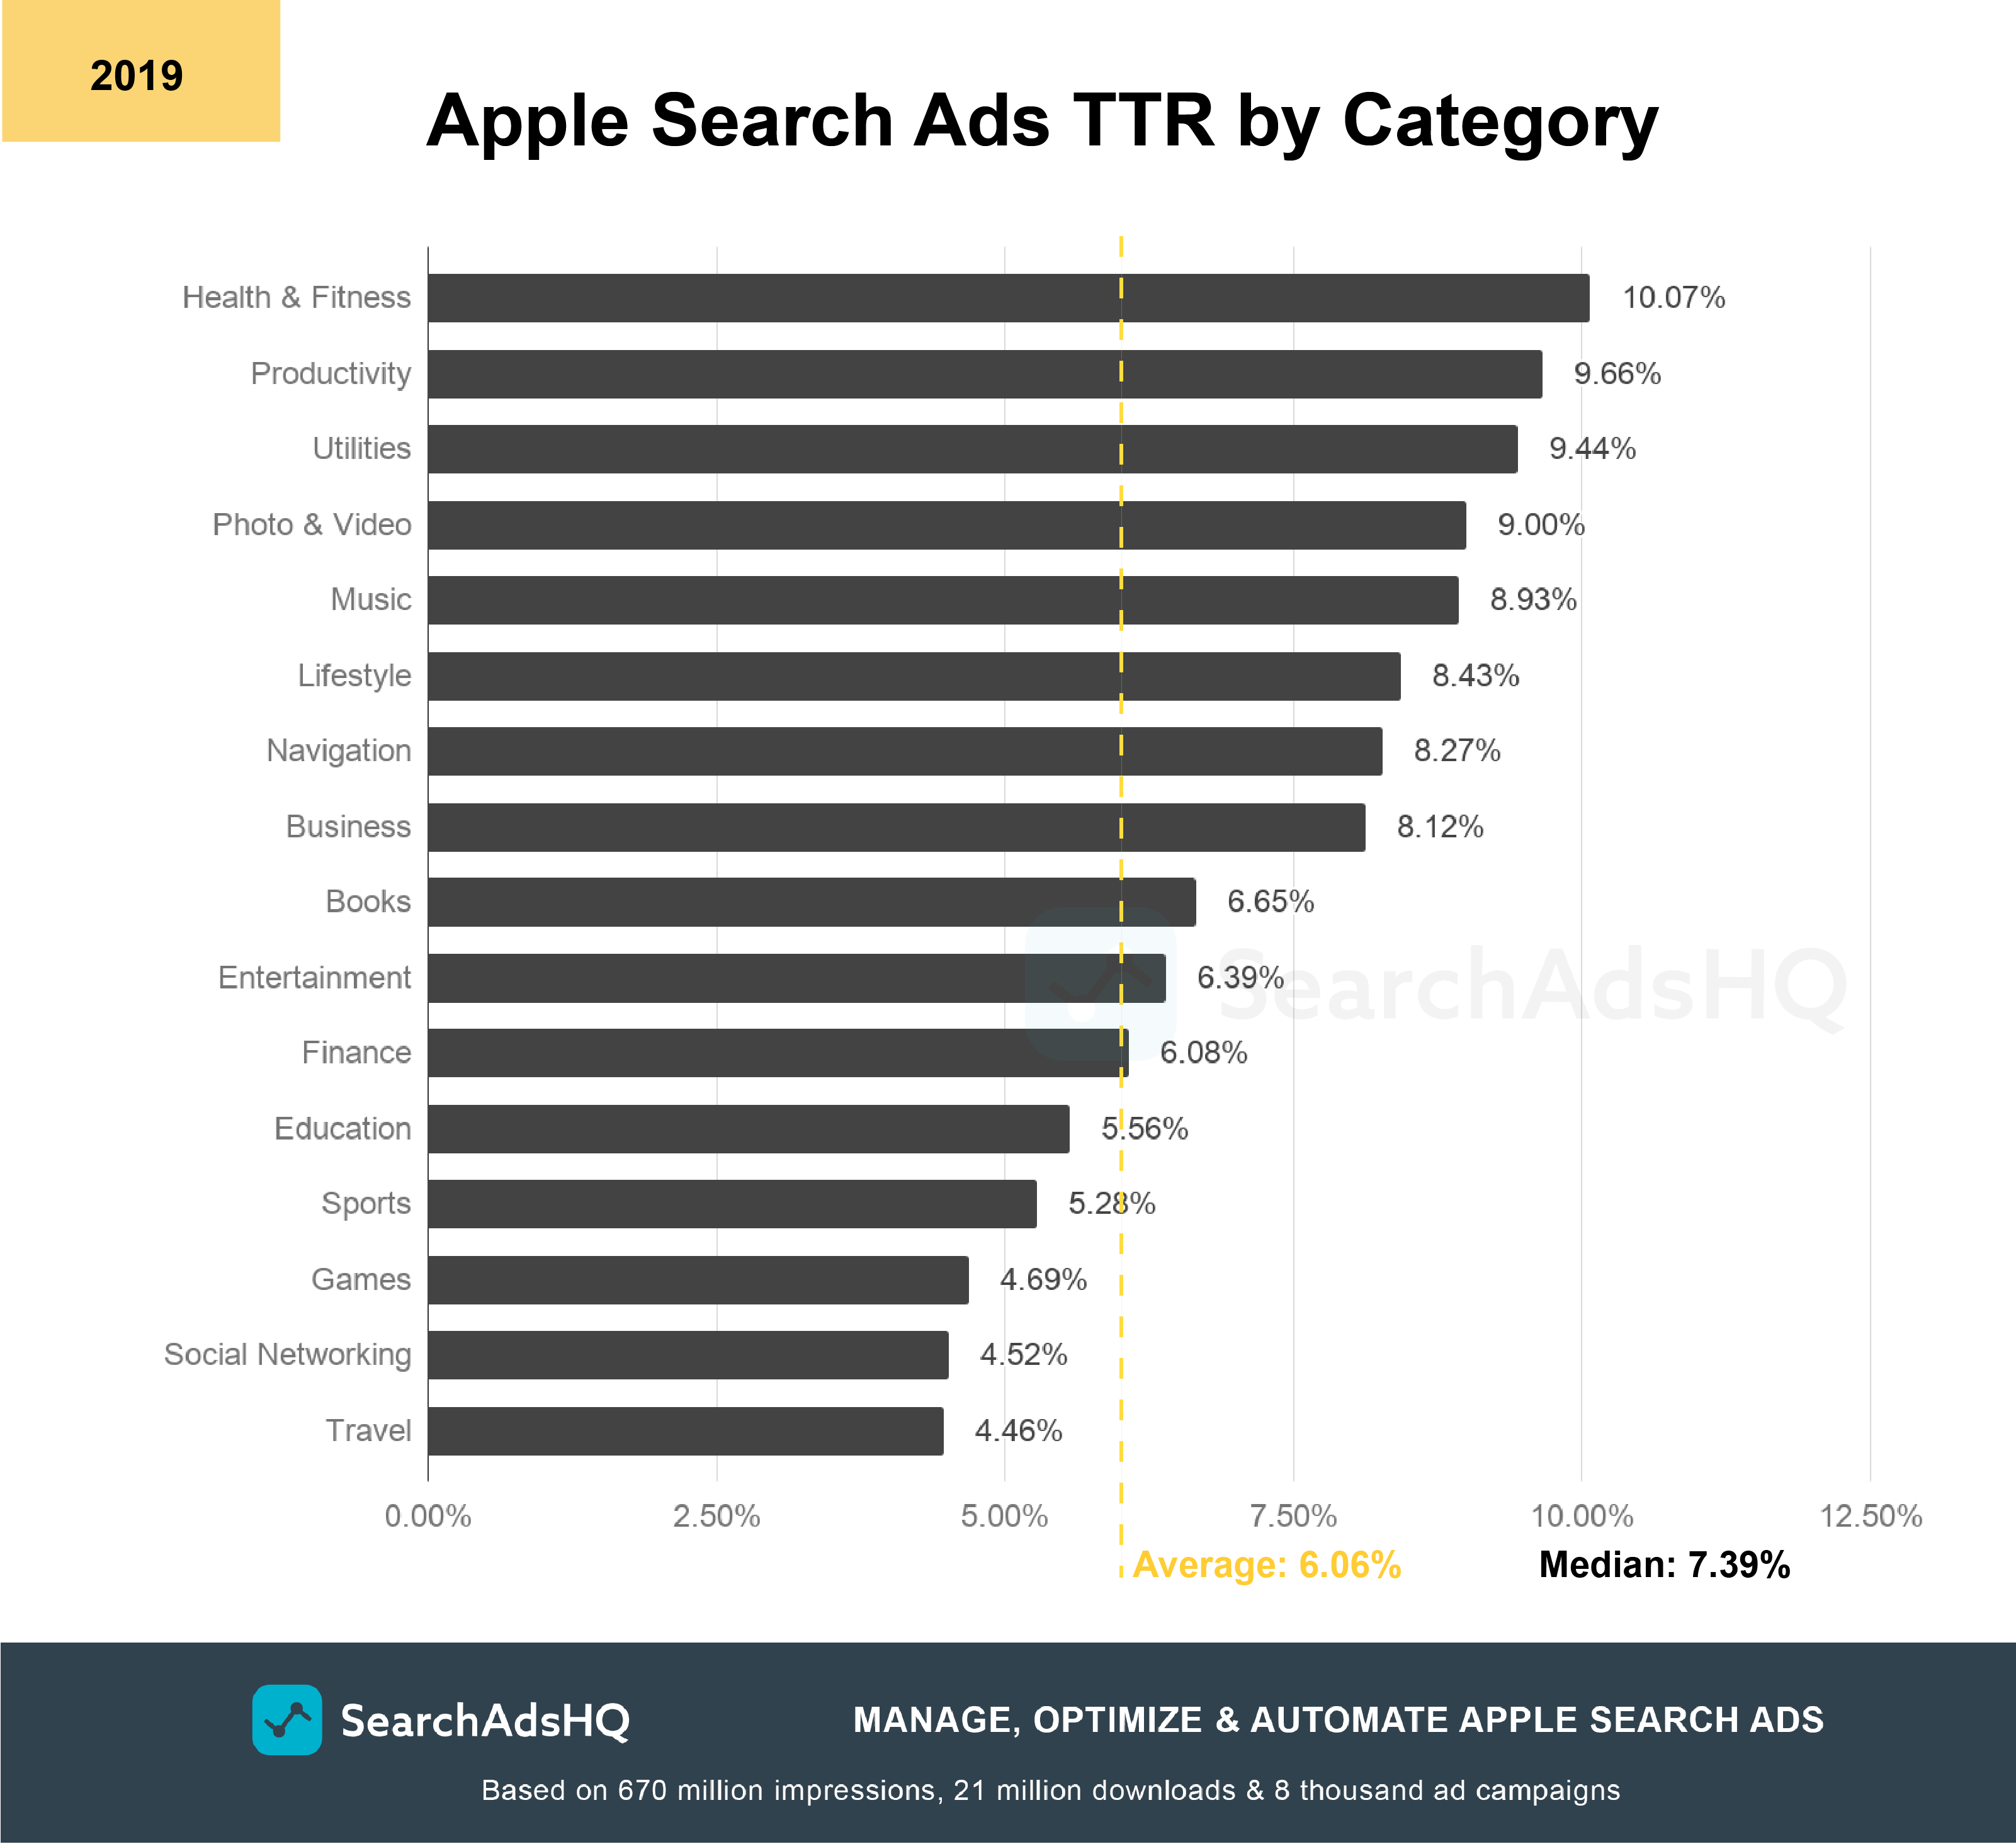
It seems obvious that in 2019 the highest average Tap-through rates are observed in Health & Fitness, Productivity, and Utilities. All average TTRs in these three categories are above 9%, which is around 3% greater than the average (6.06%).
Conversely, the lowest TTR values are in Travel, Social Networking and Games. In these App Store categories, the rate hardly reaches 5%.
What are the possible reasons for such a distribution?
Firstly, there’s a correlation between TTR and competition for generic search terms.
When users enter discovery, rather than branded search terms on the App Store, it gets harder for them to find what they really need. Users are matched to irrelevant ads, which they don’t tap on, hence low TTR. There are categories where generic discovery-centric search terms prevail, for example, Games, Travel and Social Networking, and to top it off, these categories are crowded with multiple apps.
According to Statista, Gaming is the most popular App Store category by share of available apps. Multiple users competing for discovery-centric search terms brings TTR of the category down – it’s 4.69% this year, which is below the previous year’s rate of 6.60%.
Health & Fitness, on the contrary, is where apps cover highly specific purposes and users enter more specific search terms. To discover what they need, they may play around with ‘calorie counter’, ‘period tracker’, ‘weight loss’, ‘home workout’, and a big bunch of other search terms related to the industry. Specific keywords bring in highly relevant users, who are likely to tap on your ad. High TTR comes as an outcome – $10.07.
To learn more about the performance of specific and general keywords, get our 2019 Apple Ads keywords performance report.
Another important thing that makes a difference for TTR is the usage of branded keywords of your competitors.
When you use your competitors’ branded keywords in your Apple Ads campaigns, you are more likely to get a low TTR.
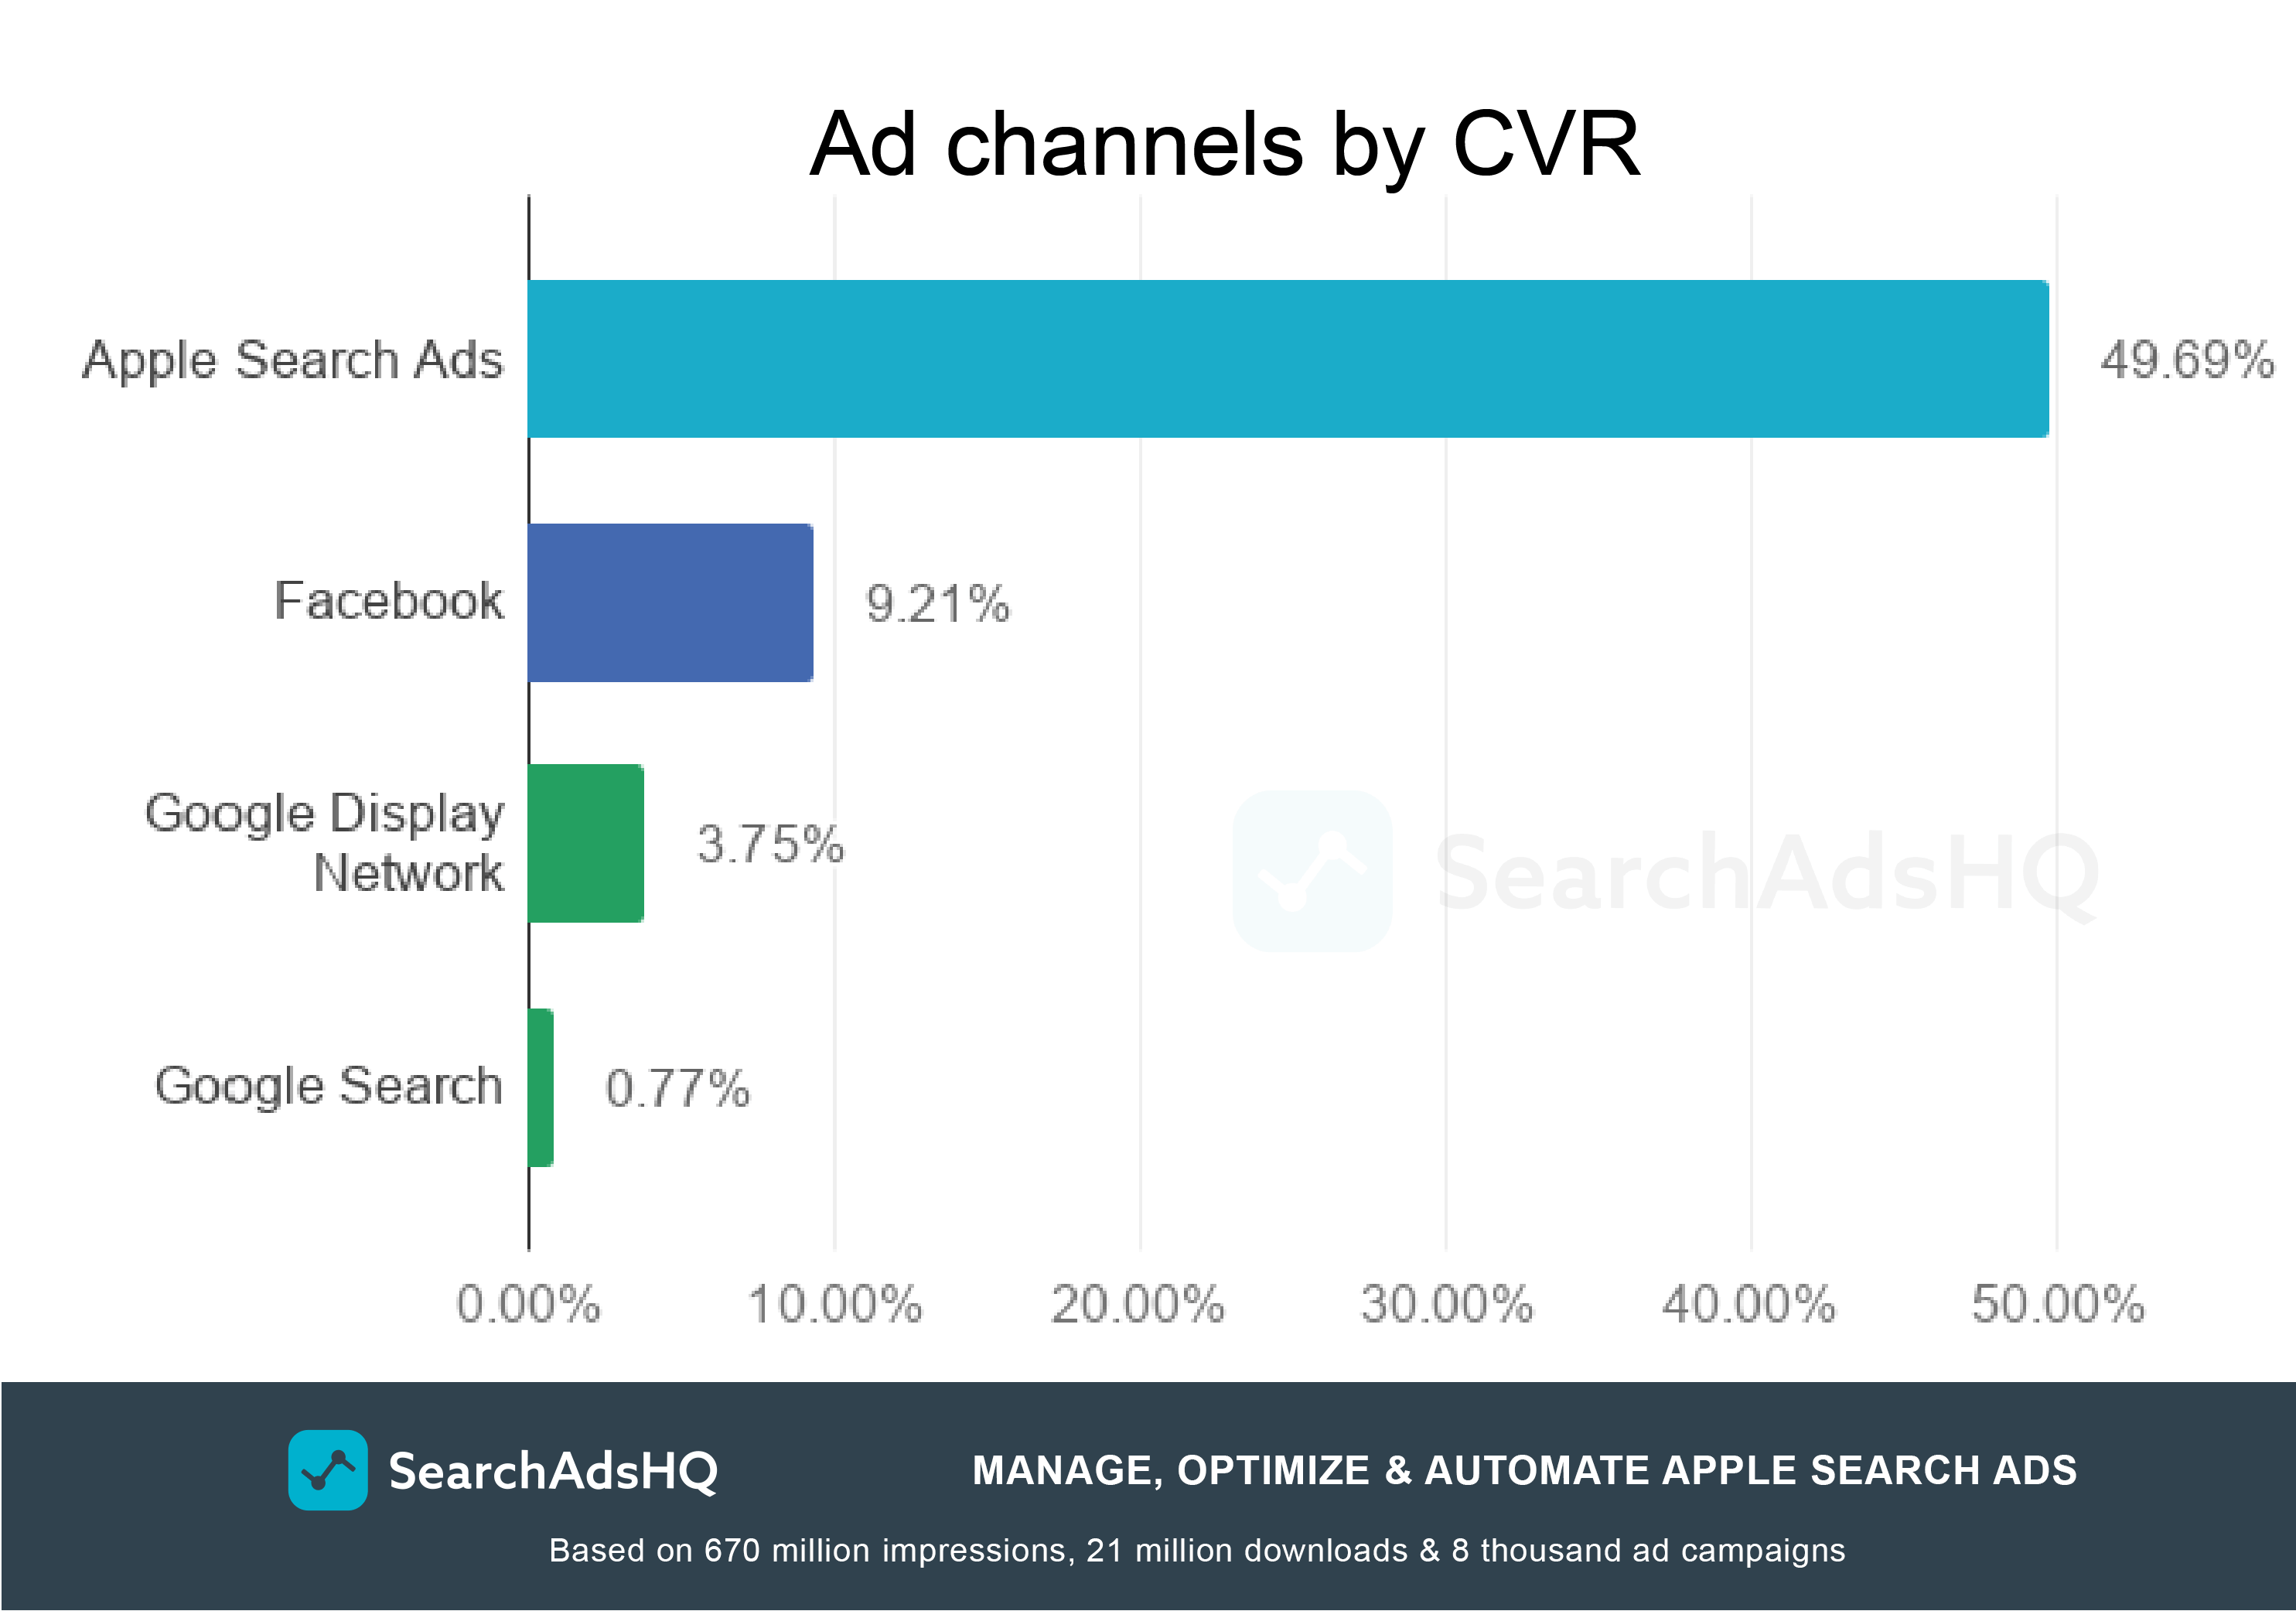
In the context of Apple Ads, conversion happens when users download the app upon tapping on an ad on the App Store. Apple claims an average conversion rate of around 50%. Our research has revealed a very close value – 49.69%.
Next, we’ve compared Apple Ads with other popular advertising networks. Please note that the data for Facebook and Google Ads are overall average benchmarks:
Sources: SearchAdsHQ, WordStream, WordStream
Apple Ads is an outright winner. It offers more than 5 times as many conversions than its closest rival – Facebook.
The thing is users who find themselves on the App Store are already extremely motivated. The majority of them (70%) utilize the store to search for apps. When this high-intent audience comes across a prime spot ad, there are good chances that your app be discovered.
Now, let’s have a closer look at the App Store categories individually:
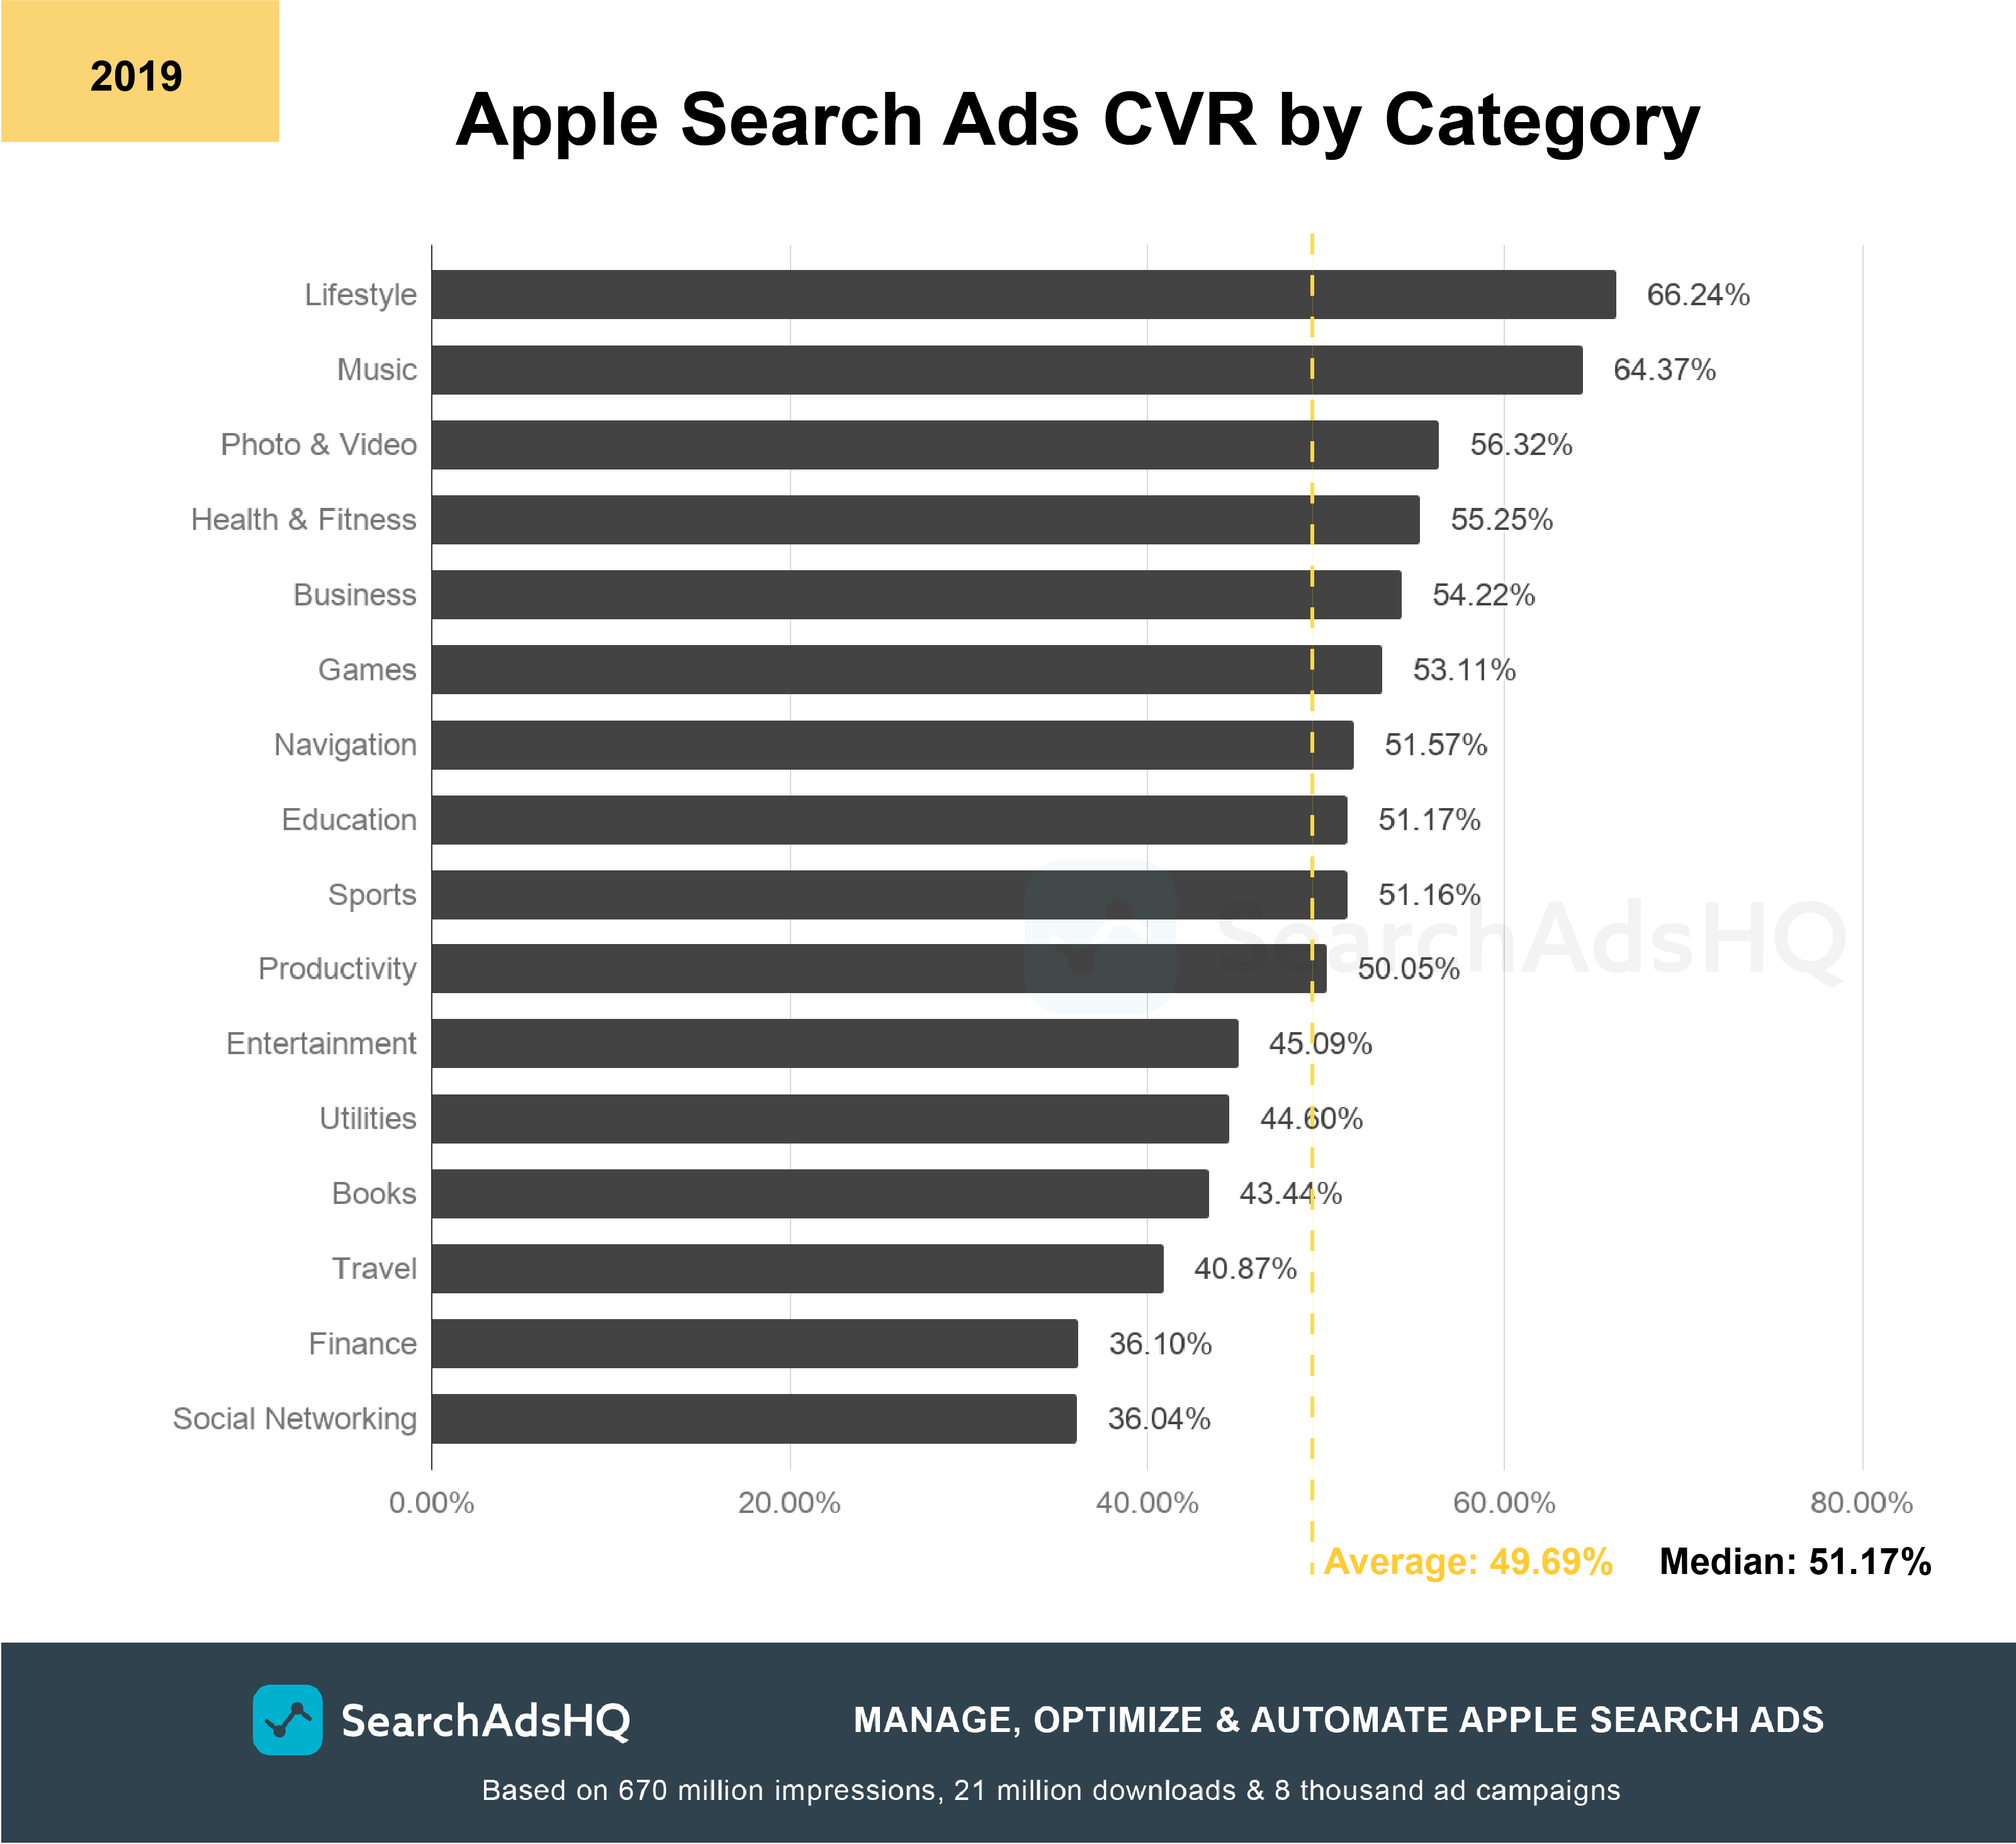
10 out of 16 categories under research maintain their Conversion Rates above the average. Lifestyle is the top performer, with the highest CVR across the categories – 66.24%. Music and Photo & Video have also shown a high Conversion Rate – 64.37% and 56.32% respectively.
Now, let’s focus on the bottom of the rating. Social Networking and Travel have shown CVR under an average of 49.69%. These two App Store categories had the lowest TTRs as well, but it’s not a tendency.
The truth is that high TTR doesn’t necessarily lead to a high conversion from taps to downloads. For example, Lifestyle has shown the highest CVR while it’s TTR is not the highest. Users may tap on your ad but not download your app. So, before you run Apple Ads, it makes sense to optimize your product page with A/B testing.
On Apple’s advertising network, advertisers pay whenever users tap on their ads. This pricing model suggests that Cost per Tap (CPT) is one of the most important Apple Search metrics to keep in mind.
The recent average CPT across all the App Store categories hovers around $0.95. It has slightly increased against last year’s average of $0.84. Now let’s look at Cost per Tap by categories and compare the recent figures with those we had last year:
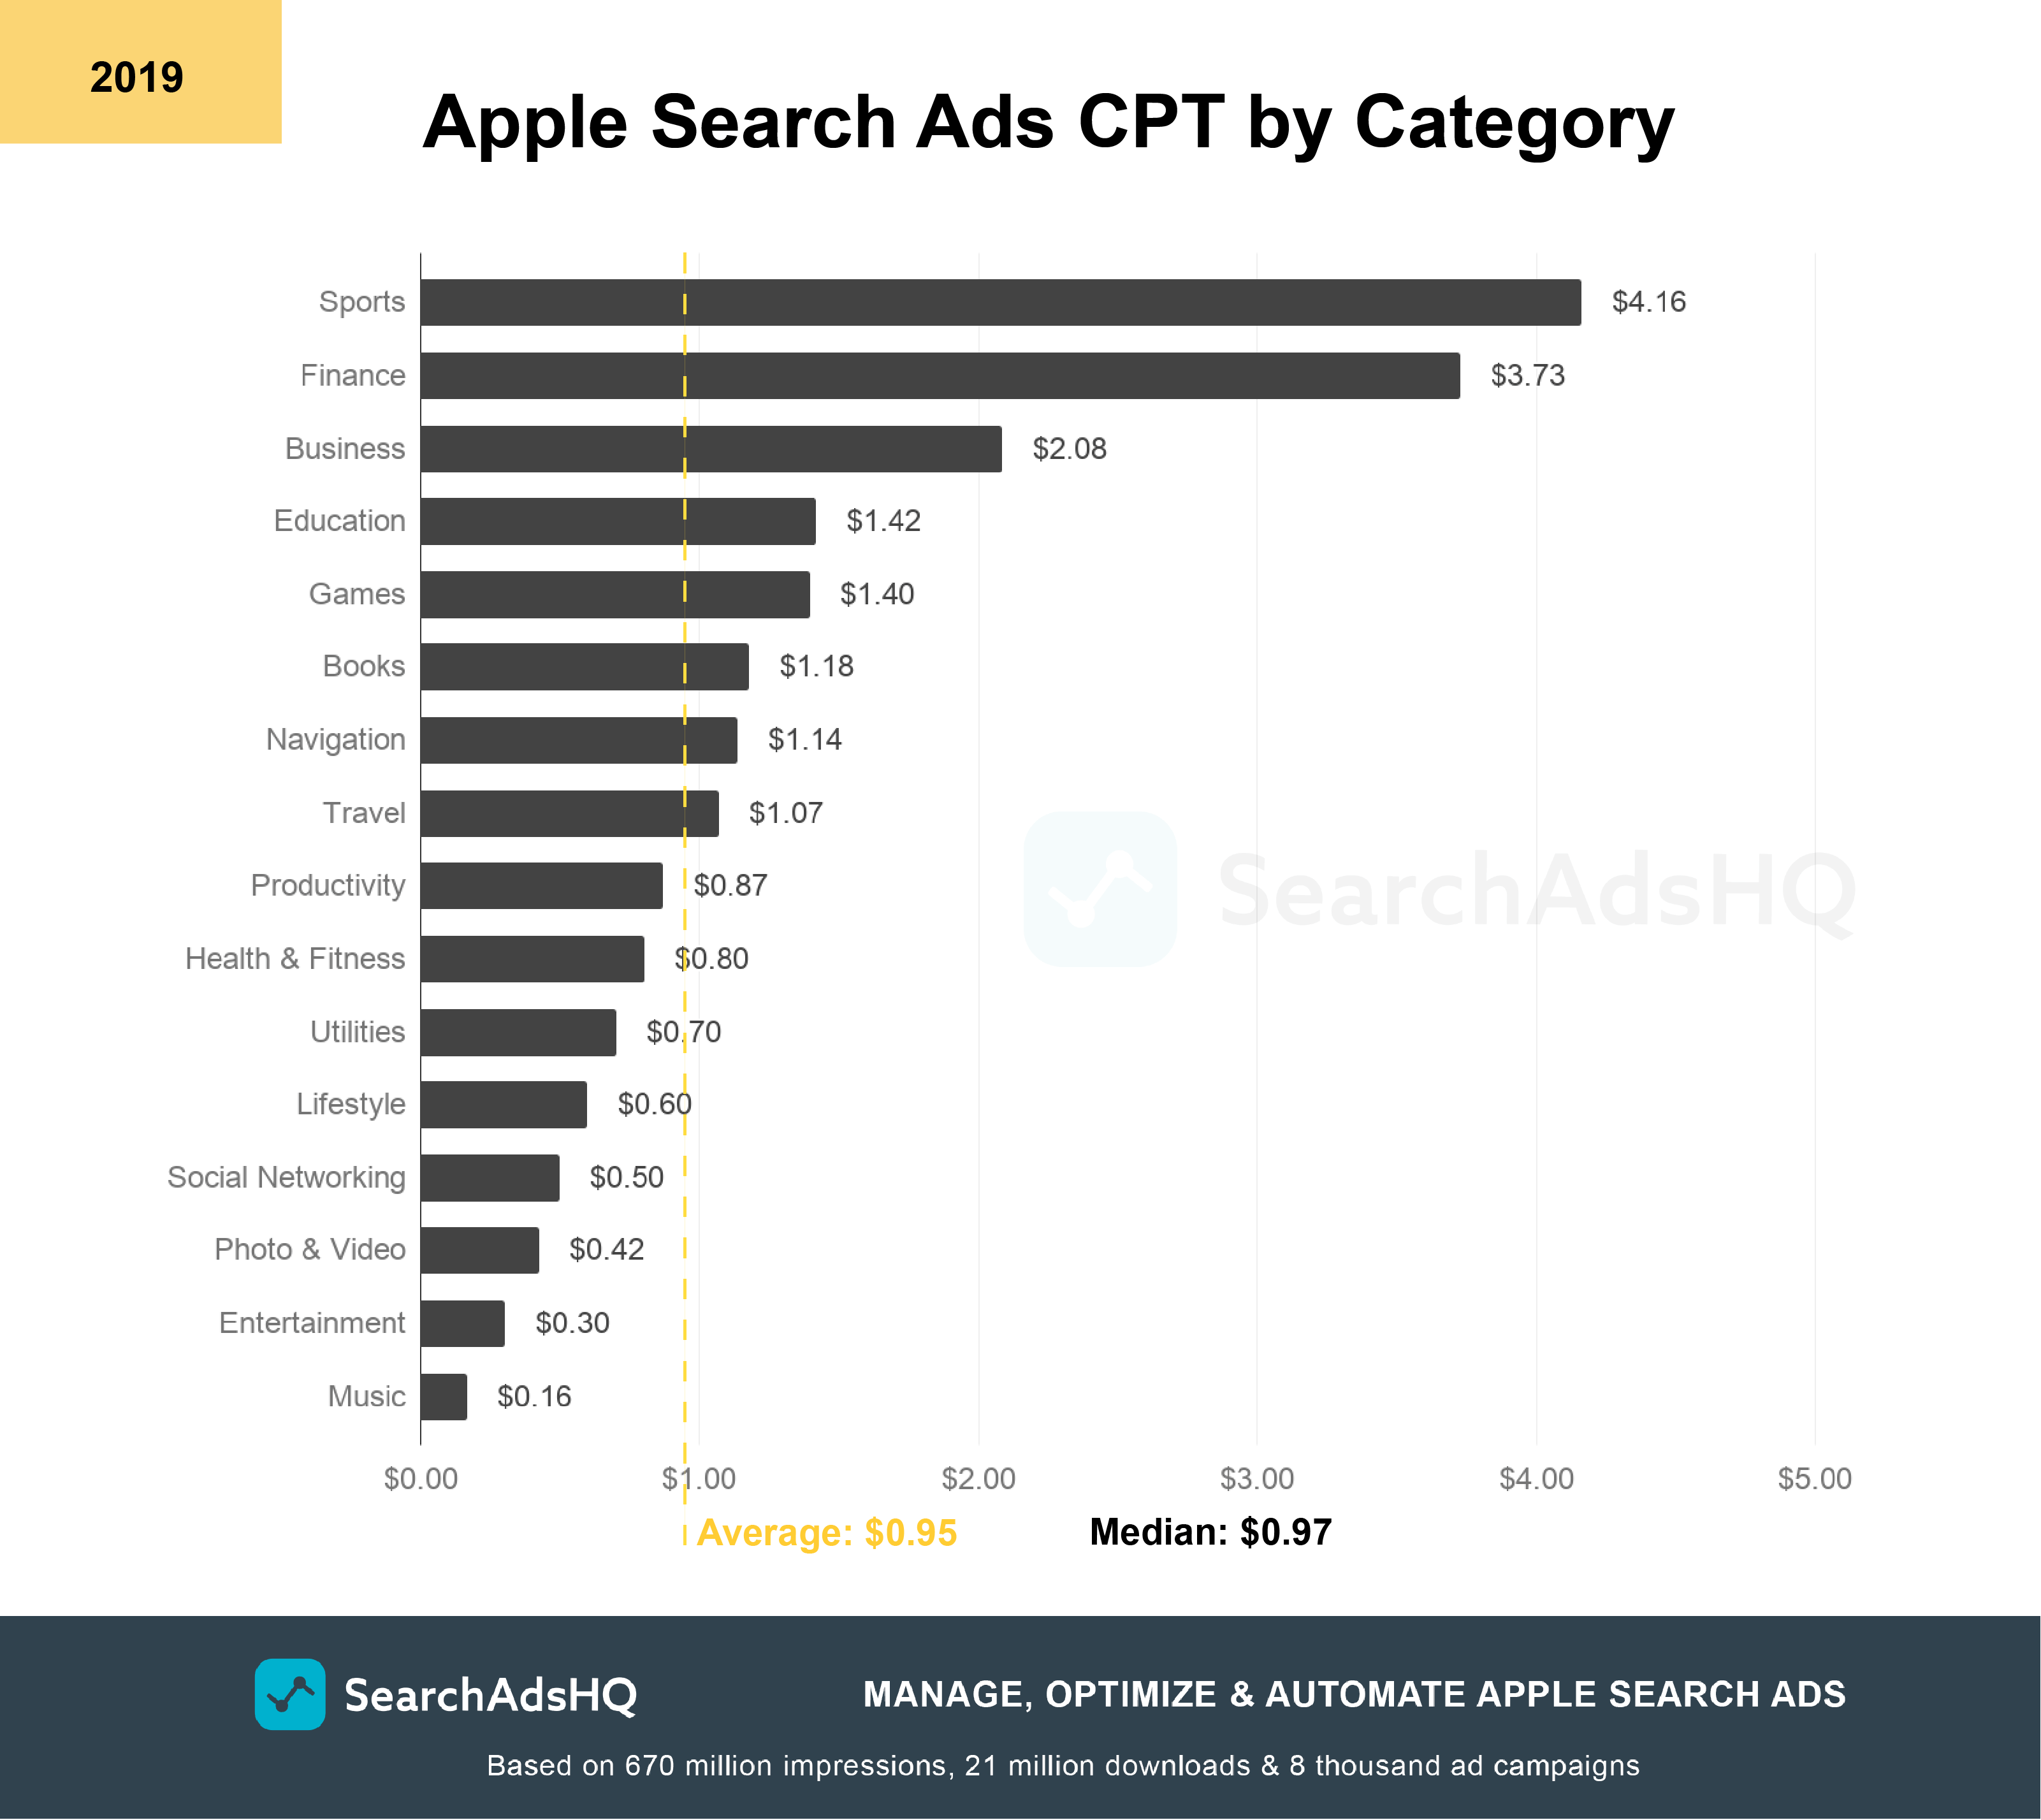
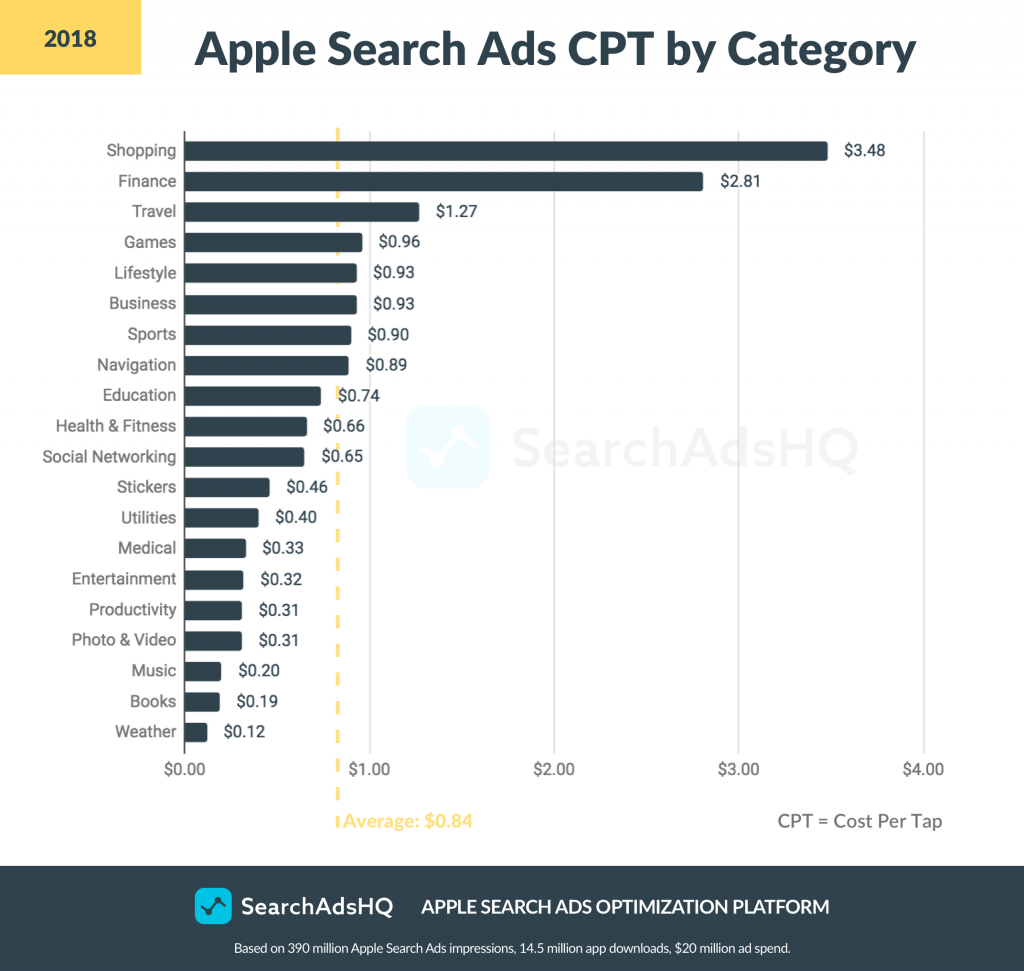
Sports and Finance turned out the most expensive App Store categories with the average CPTs at $4.16 and $3.73 respectively. Interestingly, Cost per Tap for “Sports” has grown more than four times against last year, which hints at the increased competition inside the category.
As for Finance, the bid cost has grown from $2.81 up to $3.73. In “The State of Mobile 2019” report, AppAnnie points at the “demand for both banking and fintech apps” and the increased engagement with retail banking brands. It comes as no surprise that the Finance category gets more competitive and expensive.
The most popular App Store categories by share of available apps – Games and Business – have both seen a boost in their CPTs, at $1.40 and $2.08 respectively.
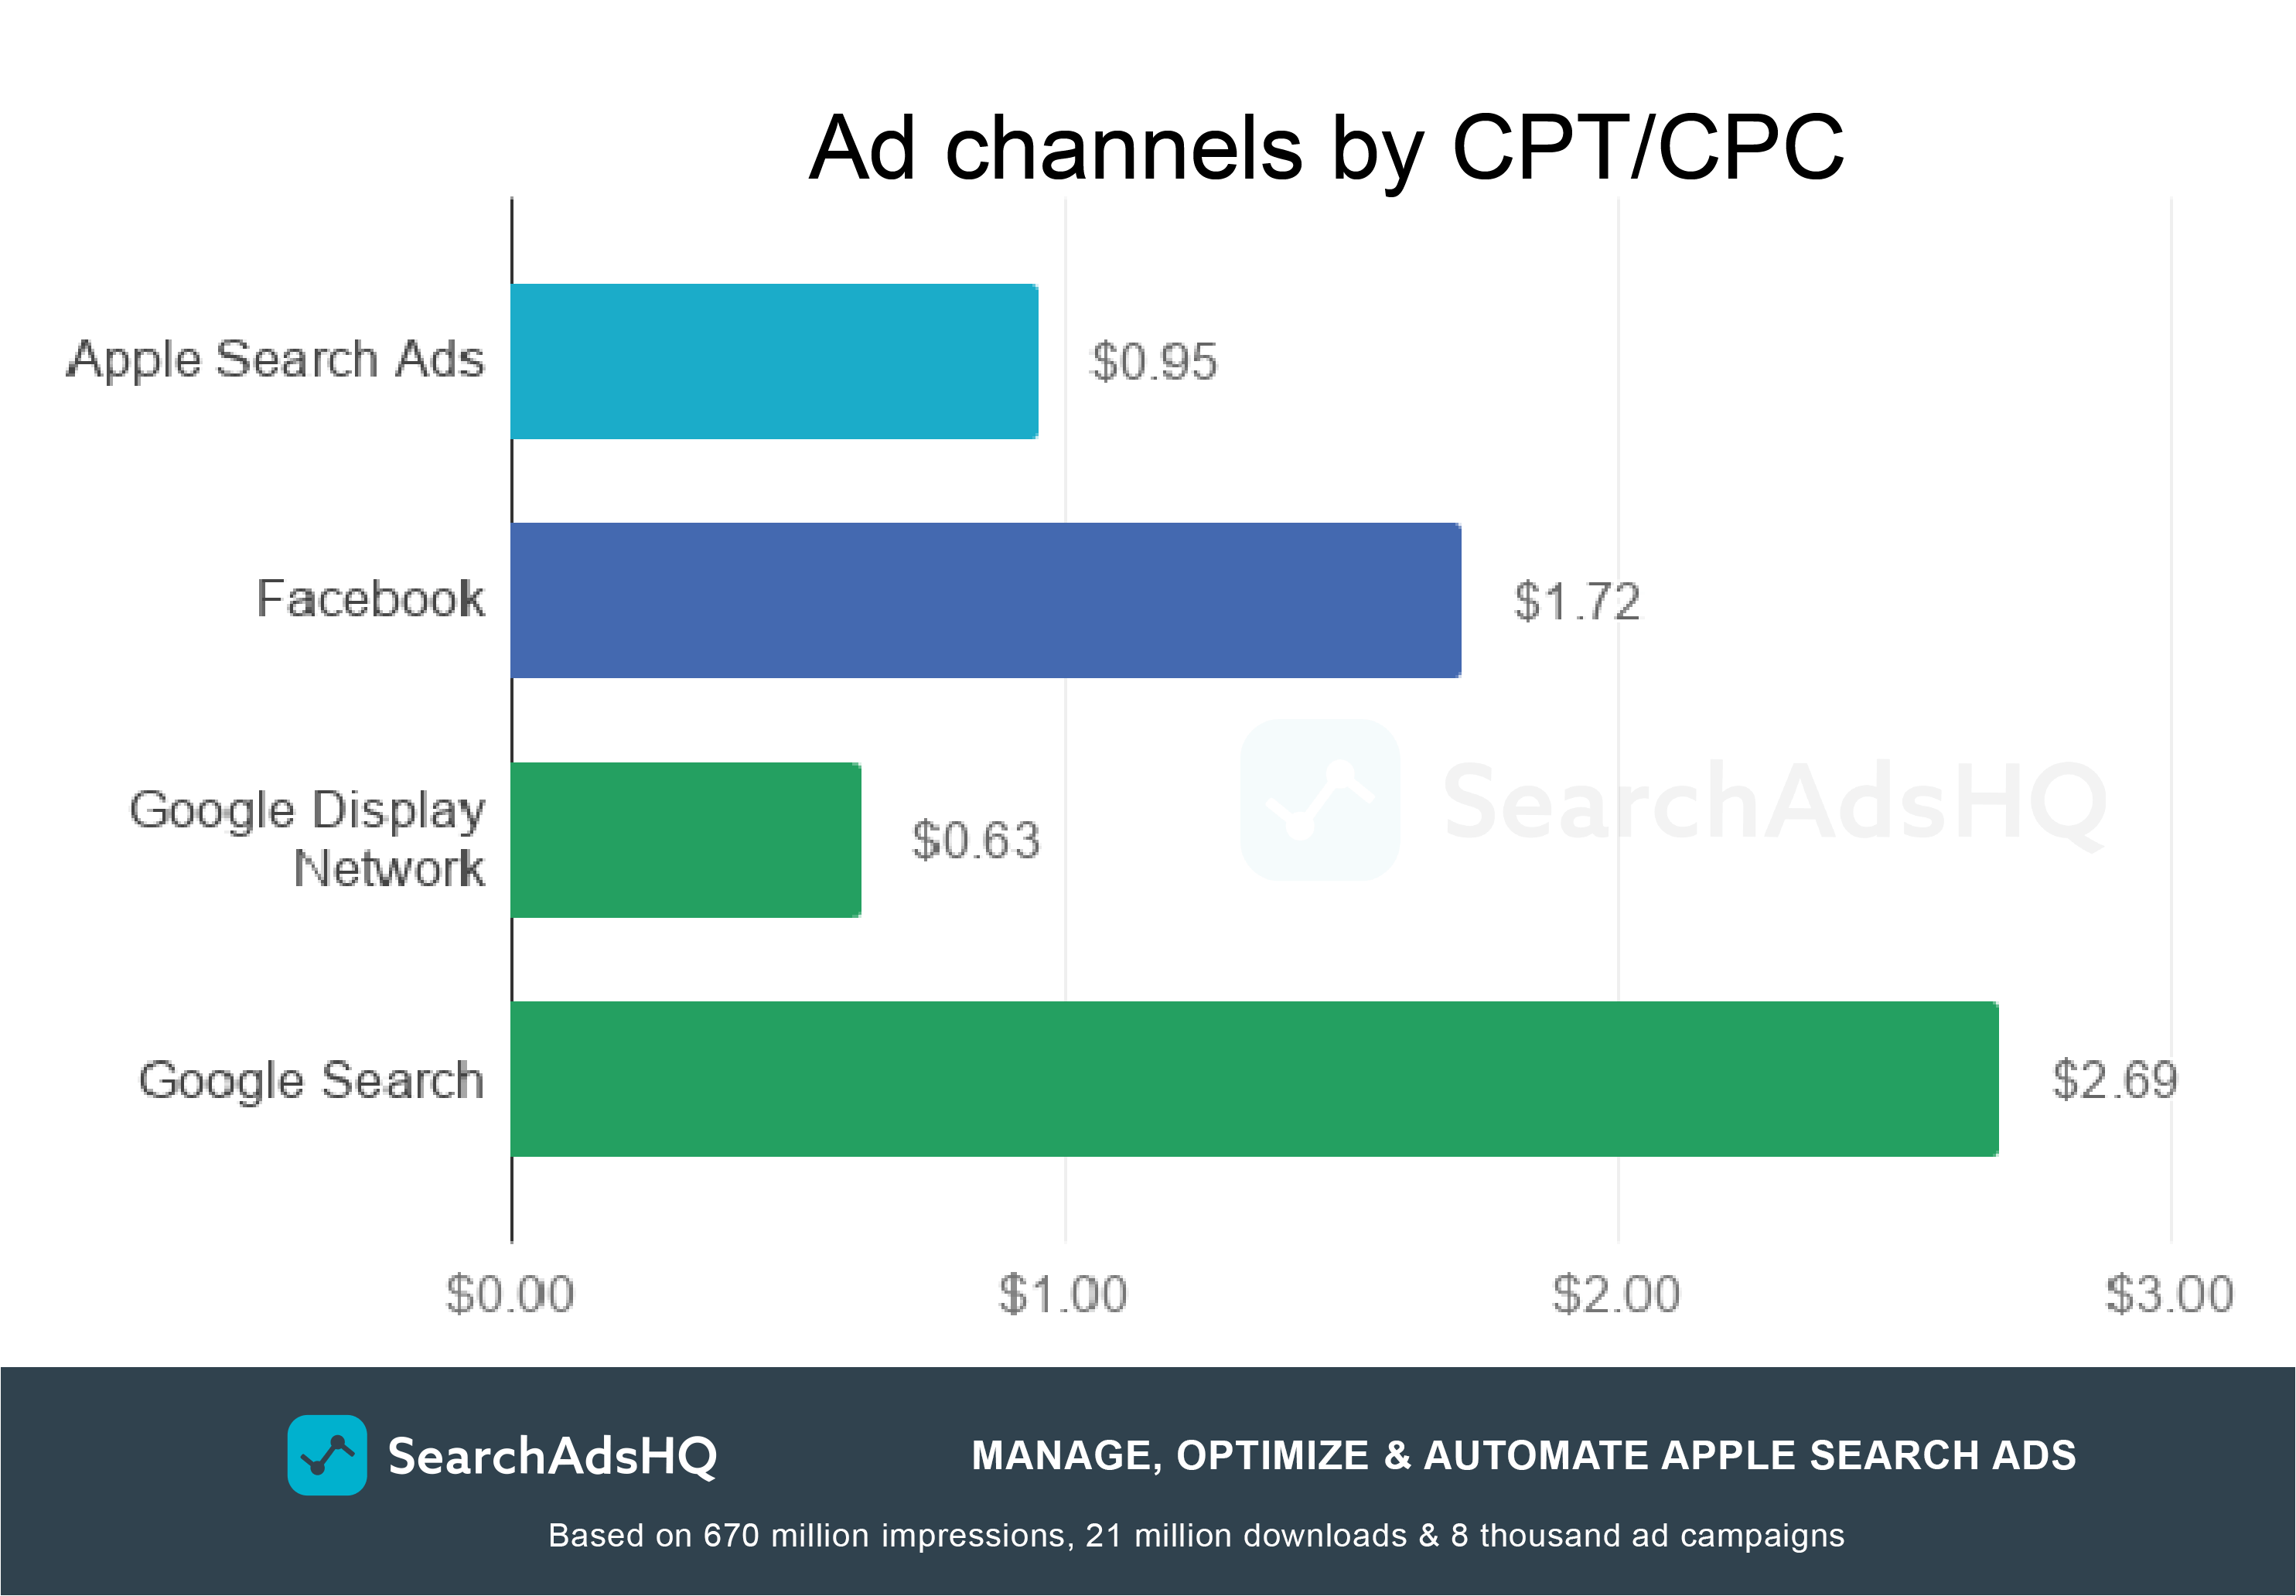
Overall, is the average cost per tap of $0.95 high, low or reasonable? To figure it out, it makes sense to compare Apple Ads with other networks. Please note that the CPCs for Facebook and Google are not the costs of mobile user acquisition, but the overall average values:
Sources: SearchAdsHQ, WordStream, WordStream
It turns out that you incur the highest cost when users click on your ad in Google Search – $2.69. The network can be extremely expensive, charging up to $50 per one click in such industries as law and insurance due to high LTV of the attracted customers.
Higher cost of Apple Ads gives way to Google Display Network, but overall charges a relatively low cost per one tap. The price of competitive keywords can be considerably higher in reality, but overall, remember that this is a premium advertising network which connects you to already interested users.
CPA is the average cost of acquiring a new user via a specific ad channel. In Apple Ads, by acquiring we mean tapping a “Get” button on an App Store product page.
In 2019, the average Apple Ads CPA is approximately $1.90, which is slightly bigger than last year – $1.76. The increased average demonstrates that the App Store is becoming a more and more competitive marketplace.
As we did with the metrics above, let’s look at the App Store categories and compare their CPAs with those of the previous year:
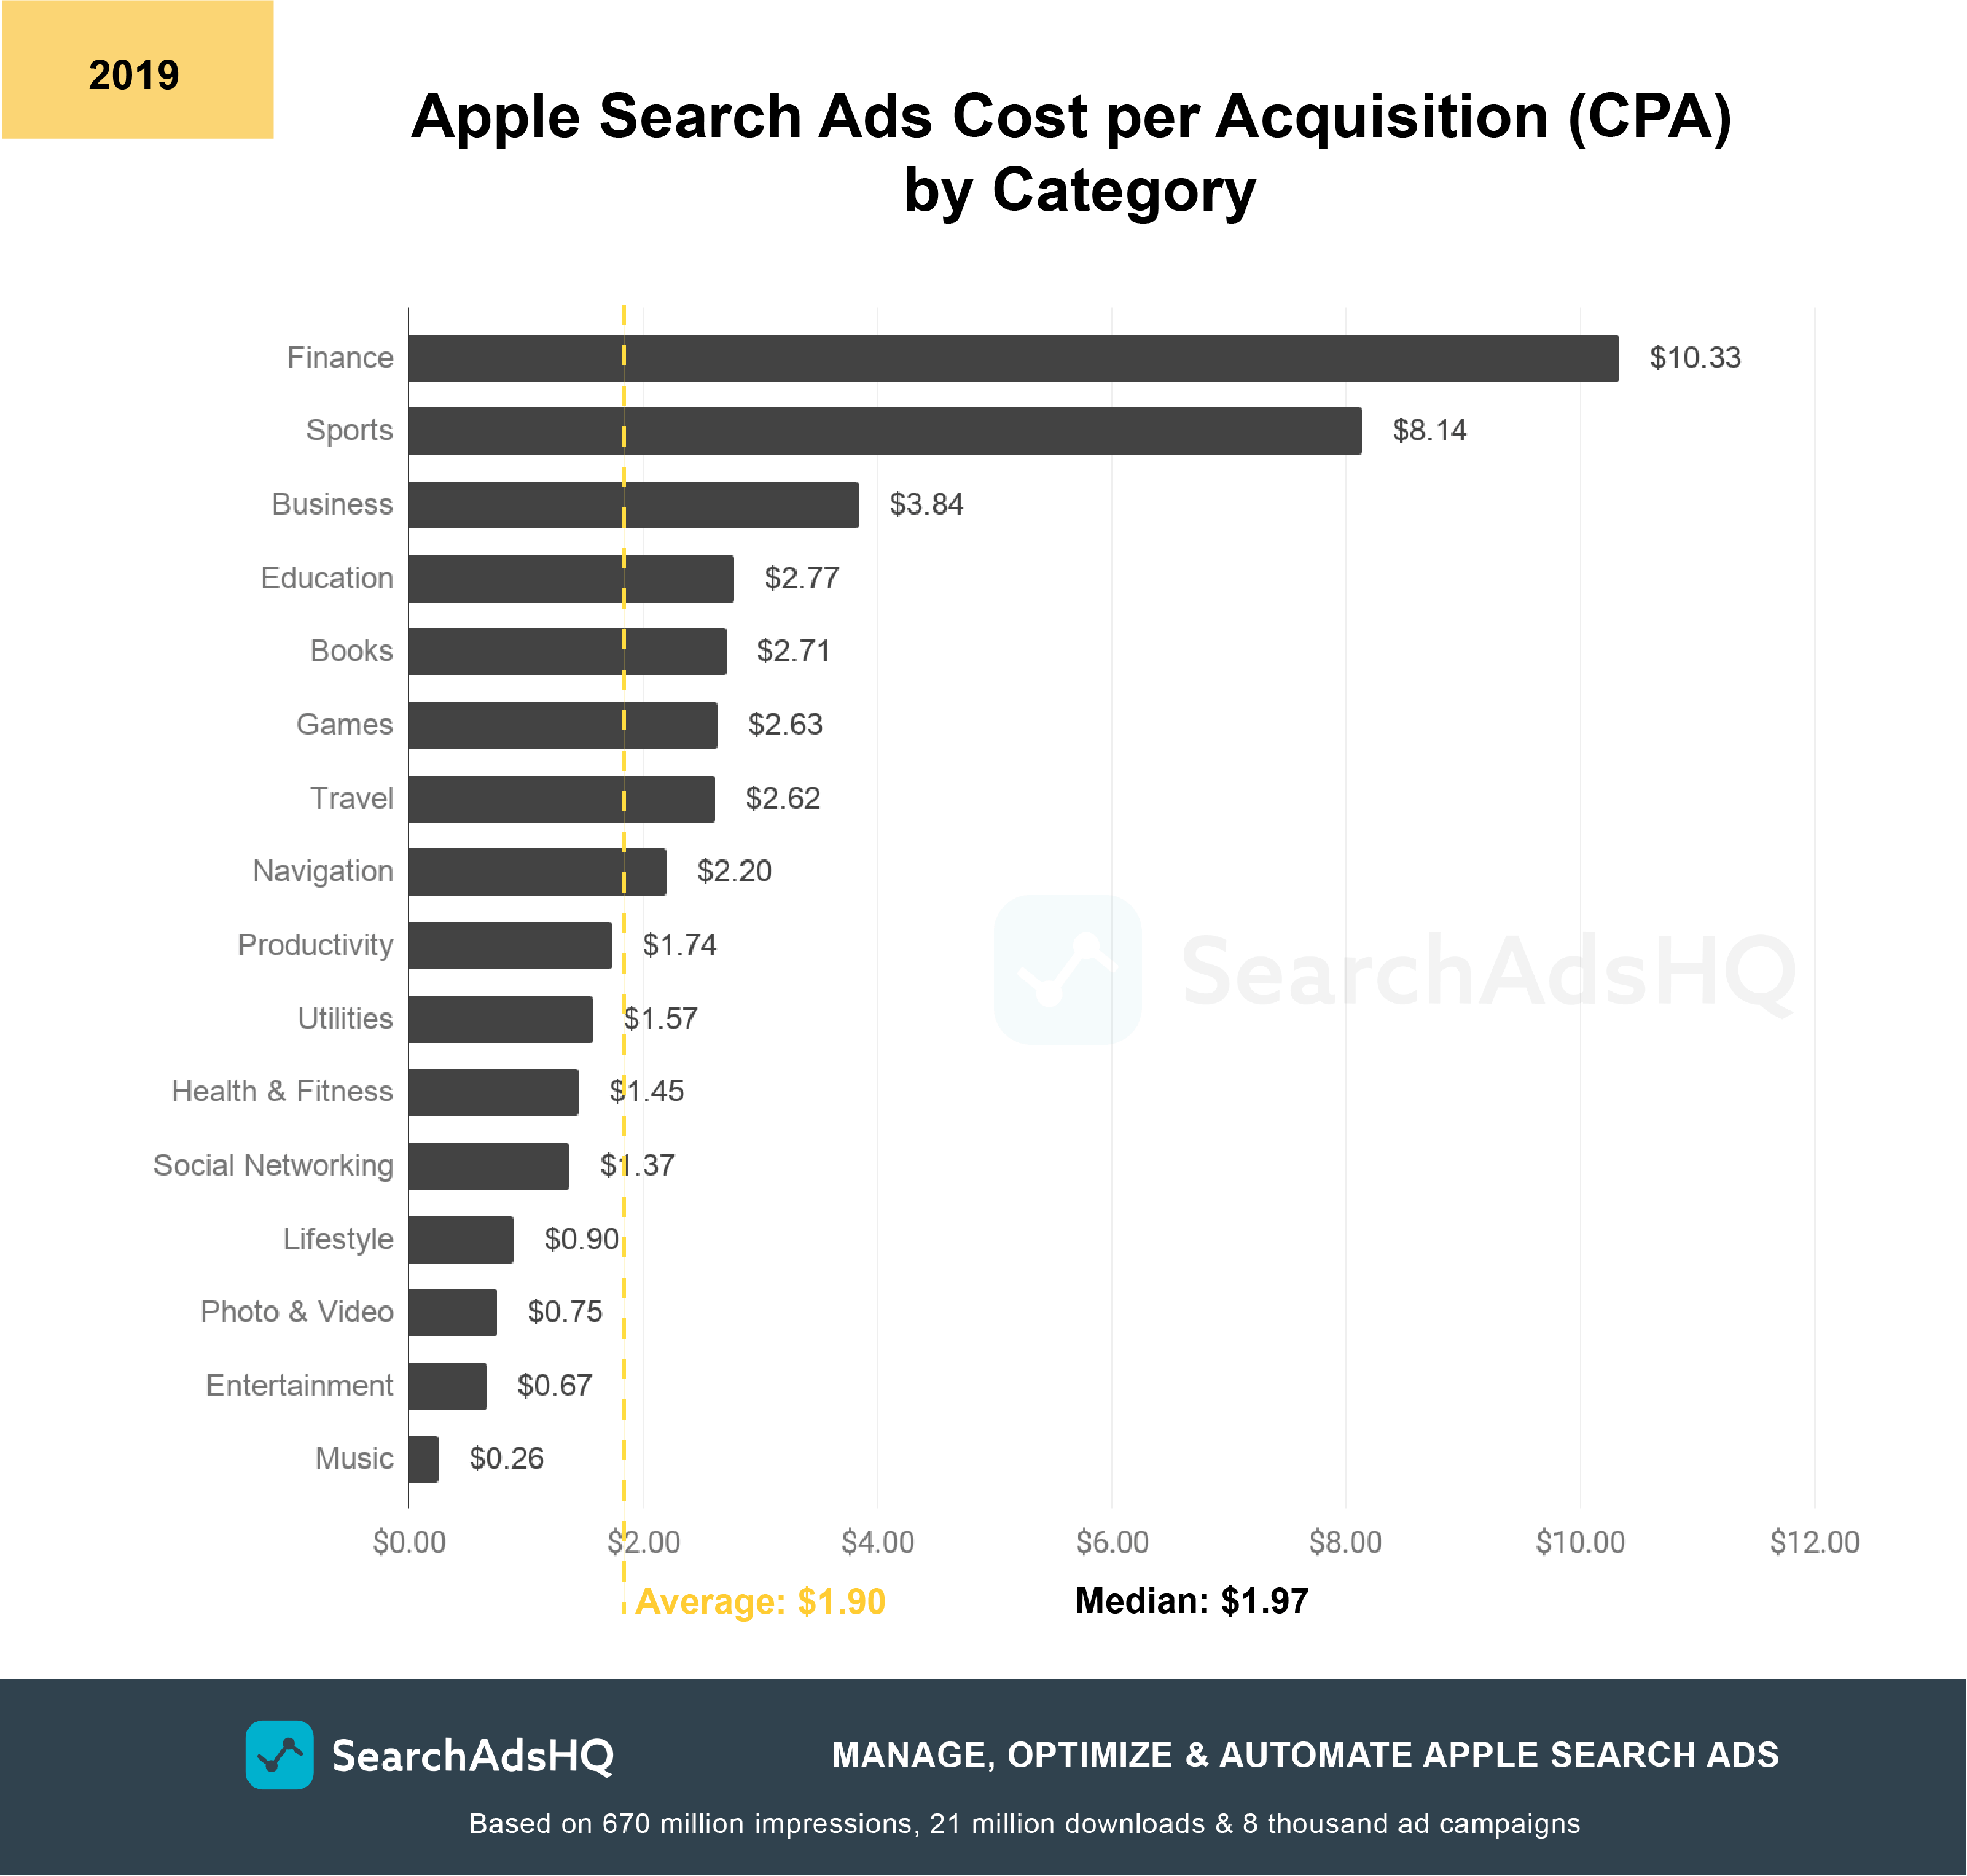
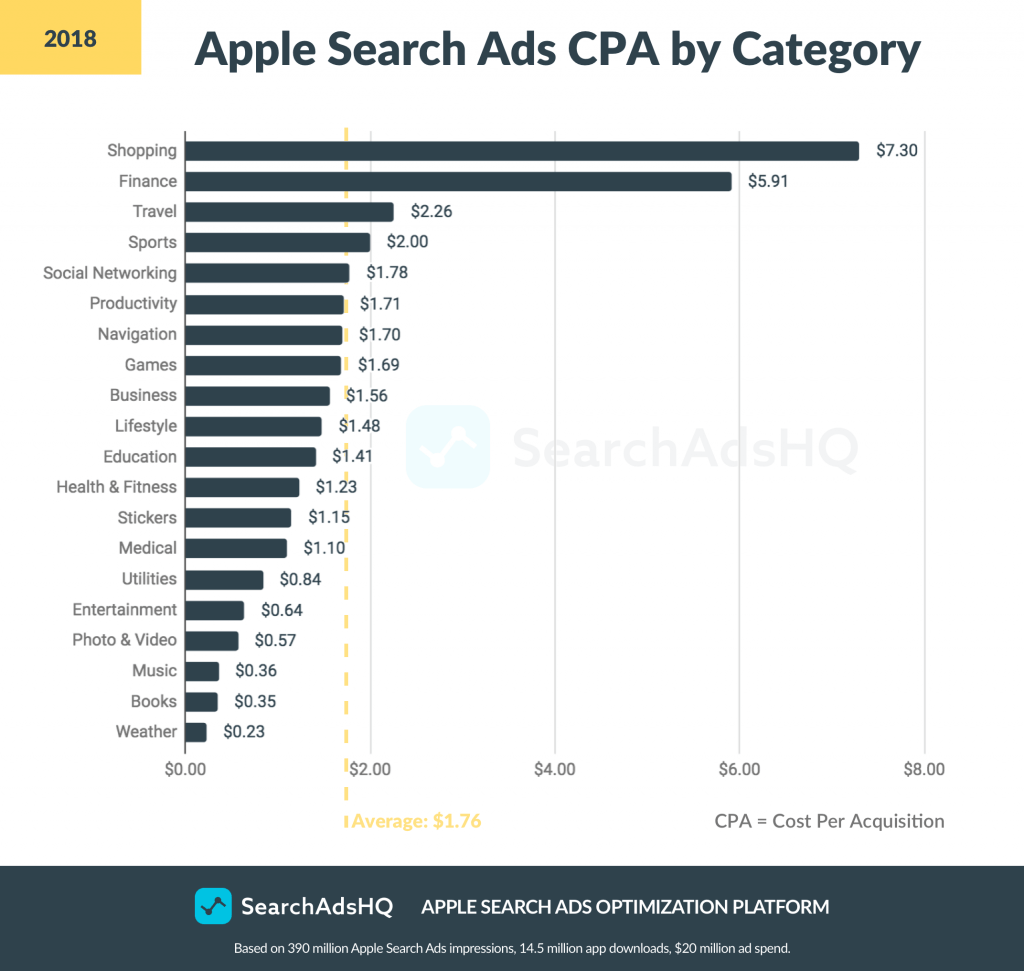
Just as last year, Finance and Sports are the most expensive categories. Note the dramatic growth in their CPAs against 2018: the cost of one acquired customer in Finance has almost doubled (increase from $5.91 to $10.33), while in Sports it has grown four times (from $2.00 up to $8.14). The boosted CPAs point to a tougher competition within the categories.
Publishers in “Music” have to pay less than the others – $0.26. It’s not the most popular category (only 2.48% of all apps on the App Store), which, along with a relatively low APRU, decreases competition and thus brings down the cost per acquired user.
Now let’s see how advertising networks differ in terms of Cost per Acquisition. We’ve gathered the average CPAs for Facebook, Twitter and Instagram (2006-2018), and measured them against Apple Search Ads:
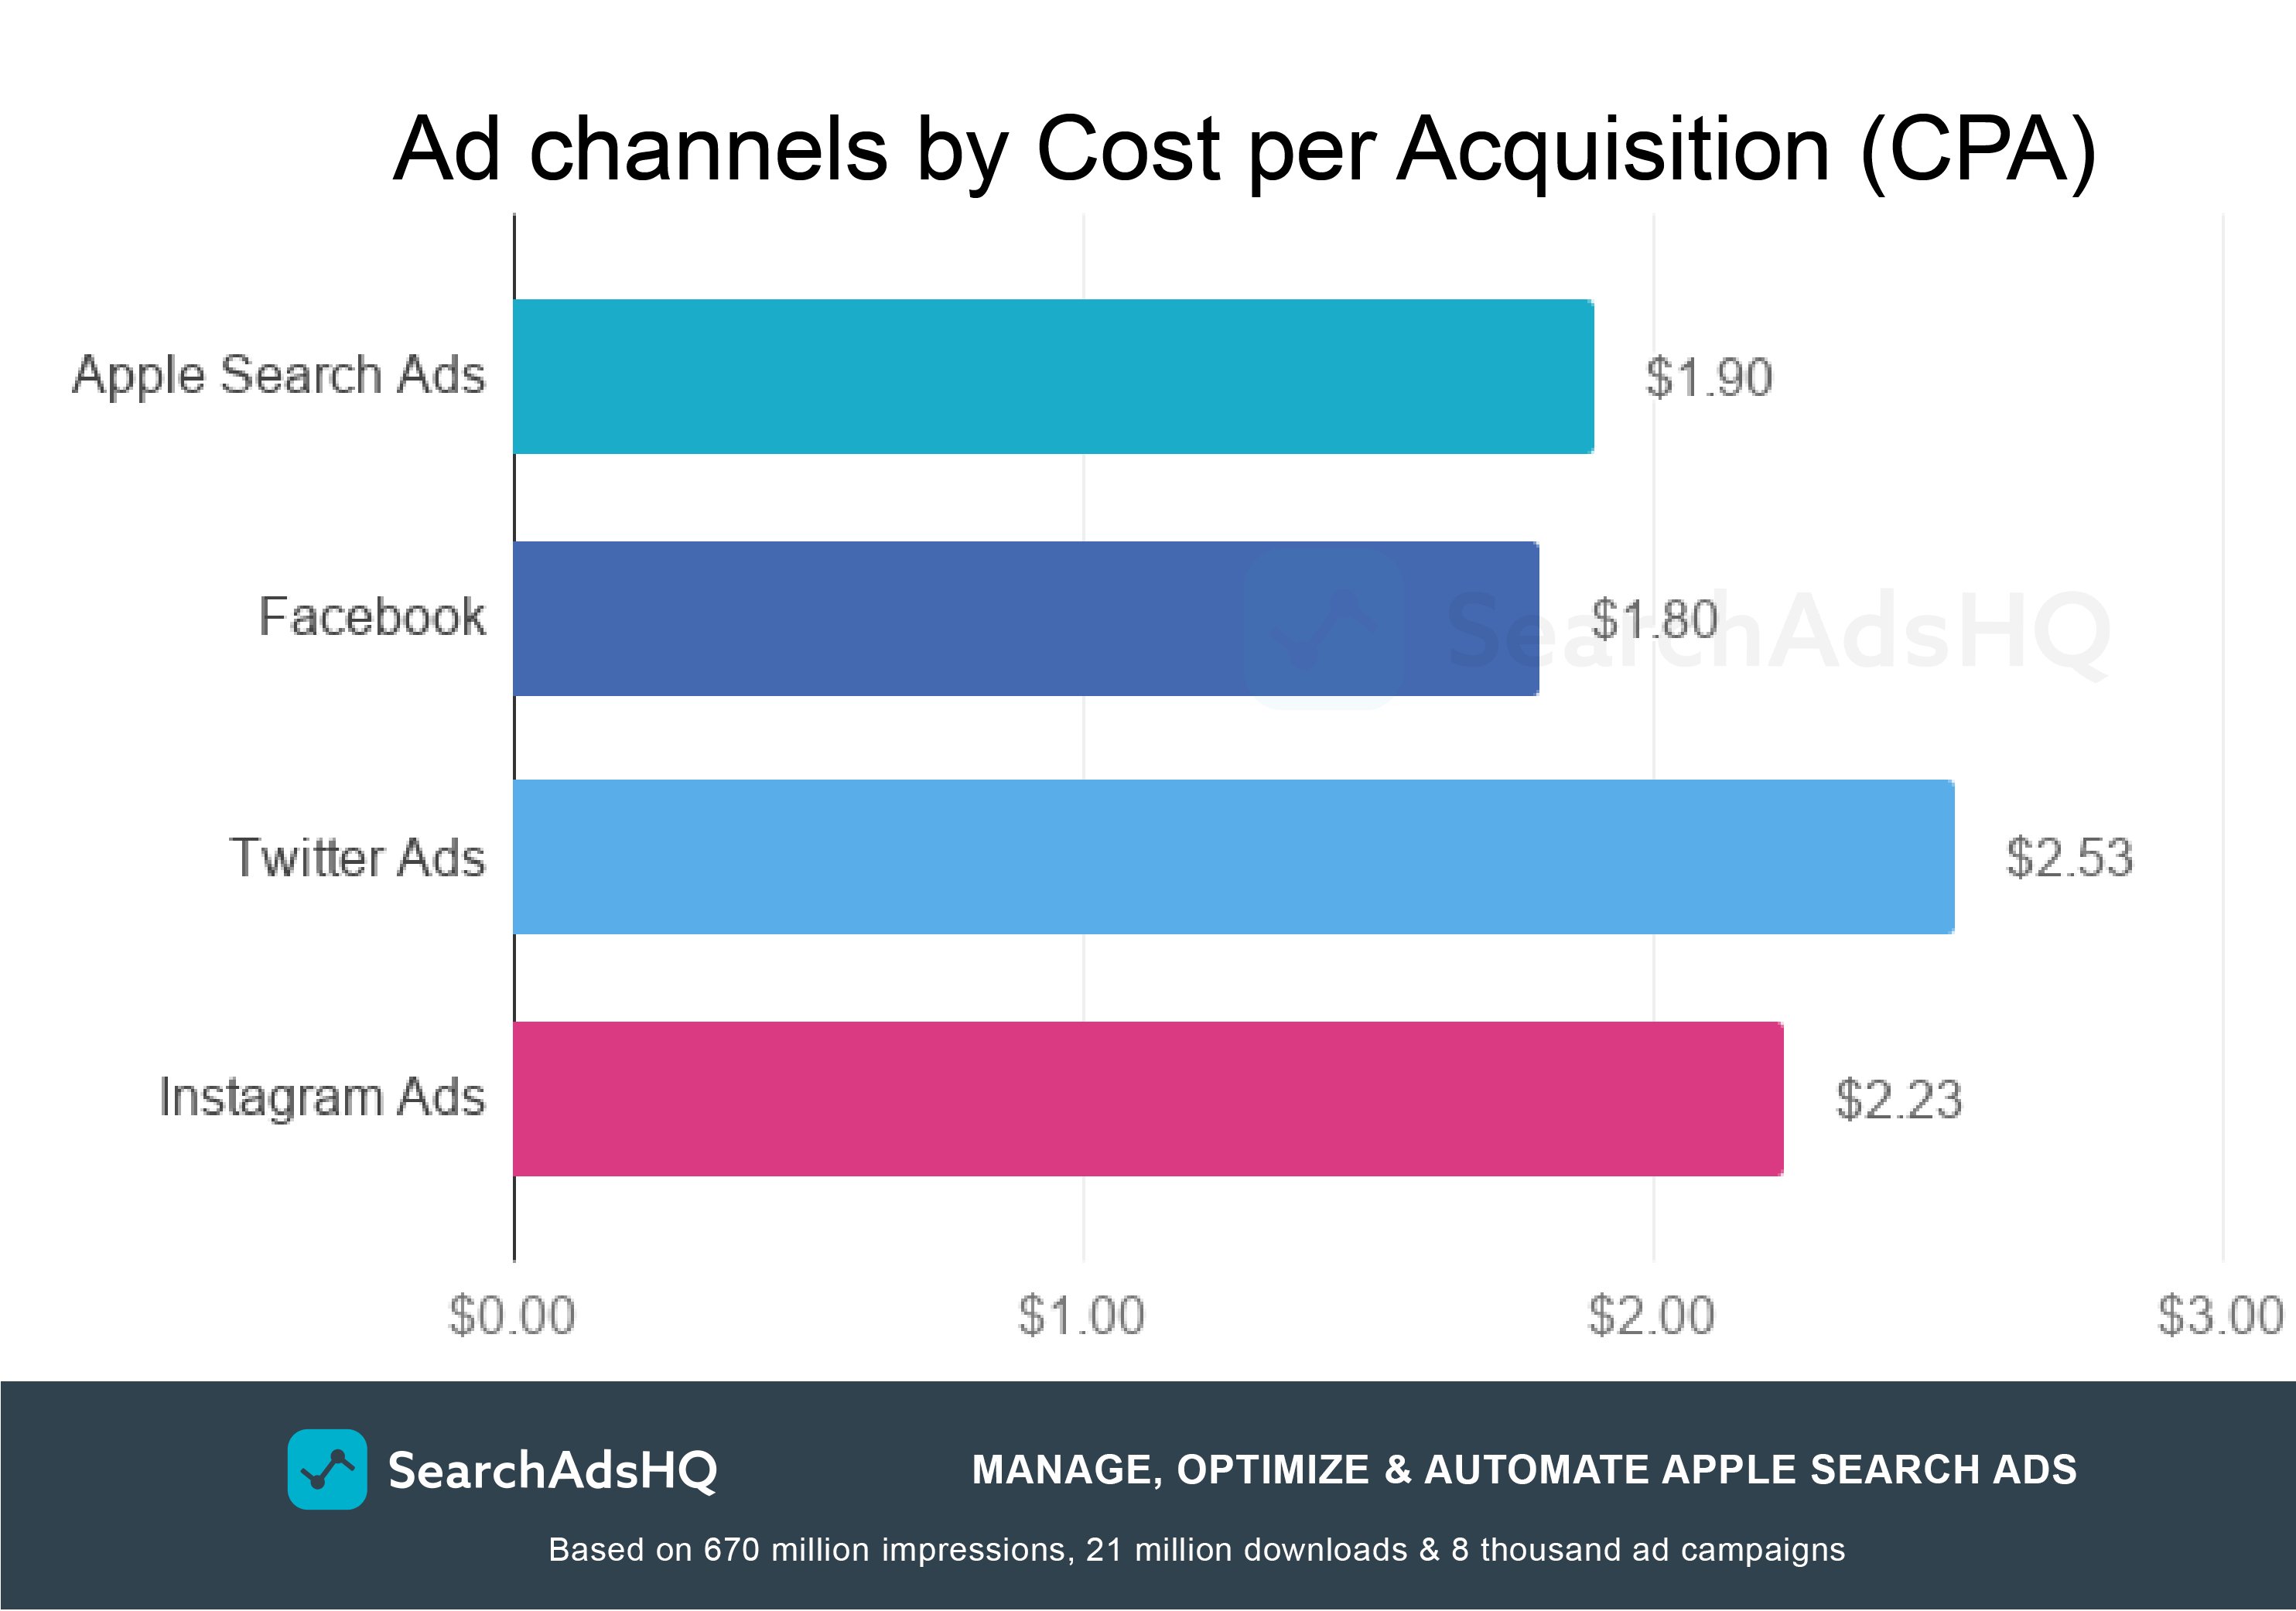
Source: BusinessofApps
Twitter allows acquiring one user for $2.53, which is the highest cost. Instagram Ads (owned by Facebook) are a bit cheaper – $2.23 per each customer.
Facebook and Apple Ads are at $1.80 and $1.90 respectively. Although the acquisition costs very close, Apple’s advertising network brings in more high LTV users in comparison to Facebook. On the other hand, Facebook outperforms Apple Ads in terms of the audience reach, being the biggest social network with over 1.4 billion monthly active users.
We hope that the benchmarks above will help app marketers understand their performance better. Want more industry insights? We’ve got fresh Apple Ads benchmarks 2021. Get them in a free PDF together with the average stats by categories and storefronts. All in one place!

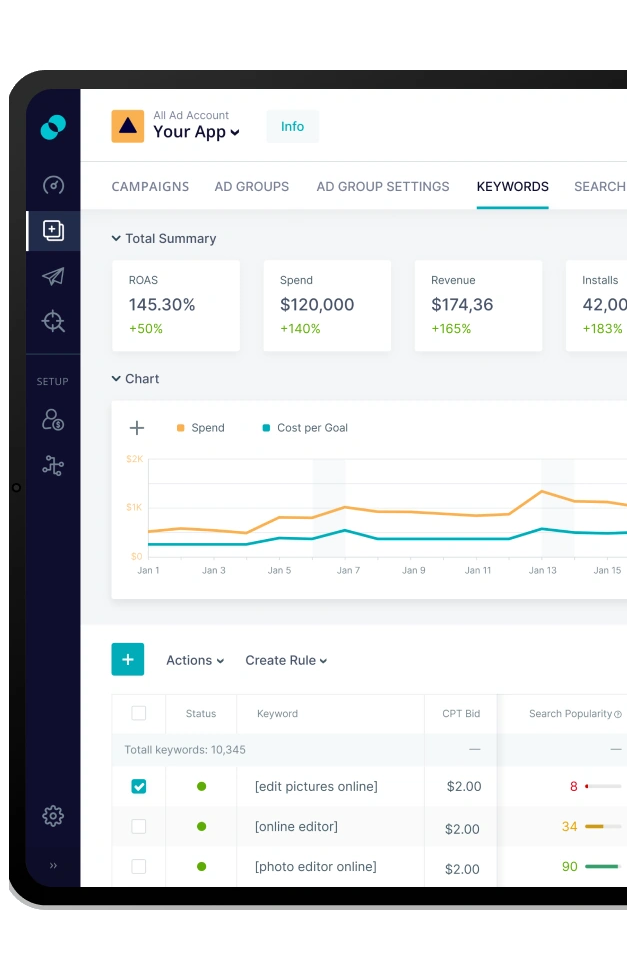
SearchAdsHQ is a platform to manage, optimize and automate your Apple Ads campaigns. Request a free demo at SplitMetrics Acquire.