What’s a Good App Conversion Rate for an App Store Page?
 Liza Knotko
Liza Knotko
Liza Knotko

When clients call to talk about experiments they can run with our A/B testing platform, one of the questions that keeps coming up is what’s a good conversion rate. It makes sense, it’s mobile app analytics basics. Indeed, it doesn’t matter how pretty the icon looks unless it brings you more installs and makes your products the best apps to advertise.
But what’s good app store conversion? How do you measure your app store page performance? Aggregated mobile app analytics and conversion data from other apps will help you see where you stand so that you can set better, smarter, and more tangible goals.
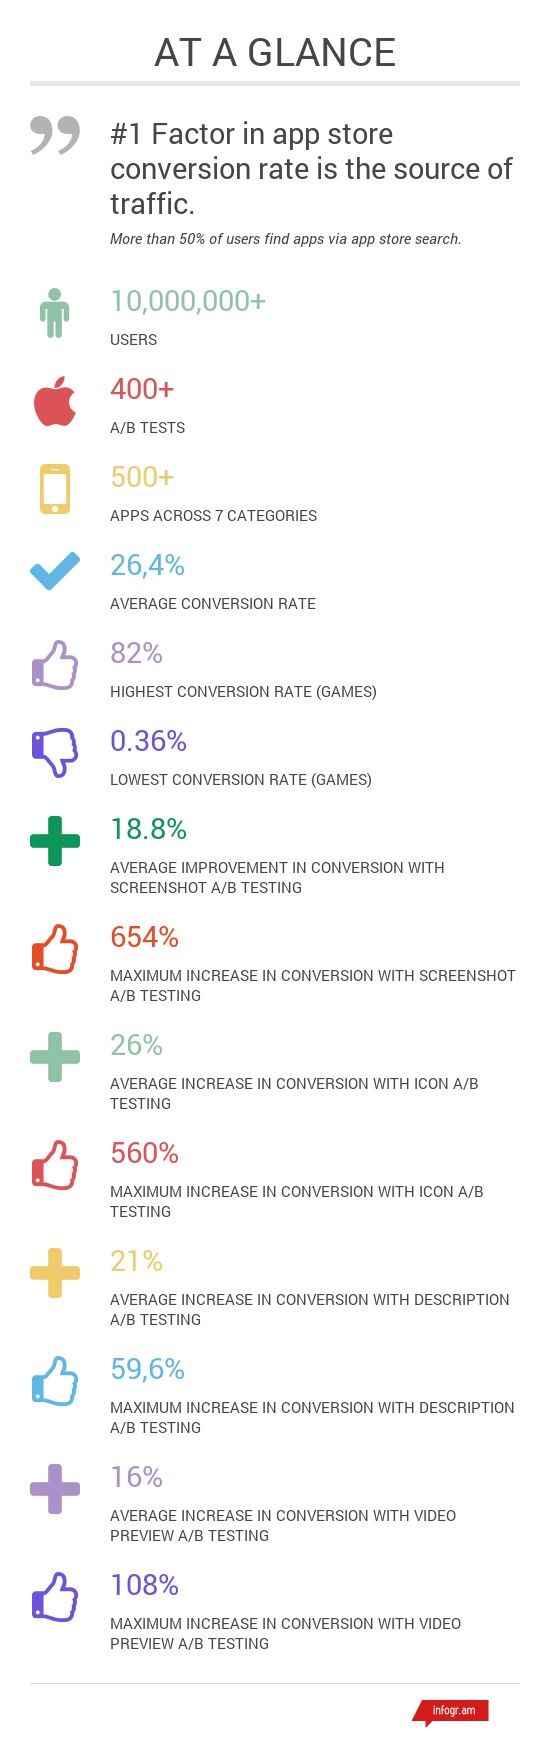
This post summarizes the data we’ve gathered from hundreds of experiments with over 10 million users. It also breaks down the median app store page and app store ads conversion stats by category. You can use these benchmarks as a starting point to guide your ASO activities (or to break and set new records in conversion optimization). Game on!
App store browsing, or organic search, remains the most popular method for finding and downloading new apps. The number of apps is growing with a rate so rapid that an average Android user now has a choice of 1.6 million apps on Google Play. For iOS it’s a bit less – but no less than 1.5 M.
While little is known about the precise workings of the search algorithm and app store SEO, mobile growth hackers are on a continuous quest to find new ways to turn lookers into buyers. They ideate, A/B test, optimize, and engage in other ASO (App Store Optimization) activities to increase the conversion rate from page views to app installs.
At SplitMetrics, we help publishers get the visual component of their app store page right. Whether visitors discover your page via organic search or through an ad campaign, we want to make sure you have all the right creatives in place. That is, you have the best-performing mobile icons, app store screenshots, description, video preview, and other elements of the page. When visitors come to your app page, you will convert and conquer. And learn insights into mobile app analytics as well.
In 2015 we conducted over 300 experiments across multiple app categories. The mobile app analytics data we’re sharing comes from 10 million iOS and Android users from our clients’ statistically significant A/B tests on icons, screenshots, description, and other elements of the app store page. The median mobile app conversion rates we give you as industry benchmarks are based on the data from Games, Entertainment, Social Networking, Education, Health and Fitness, Travel, and Music categories.
These categories were most represented in our experiments, so the sample size could provide statistically significant data on mobile app analytics. By talking about the App Store conversion rate in this post, I’m referring to the number of app downloads divided by the number of app page views, shown as a percentage.
App Store product page conversion rate = App Store downloads/ app page views (%)
Note: The number of app store views reflects the number of times your app’s page has been viewed on a user’s device. When you’re into mobile A/B testing of your creatives with SplitMetrics, this will reflect the number of clicks you get to your page from a campaign’s link. We’ll also show you the number of users who dropped before they got to the page so that you can have the full picture. For the accuracy of mobile app analytics benchmarks, we share in this post, we excluded dropped visits from the data.
Does Conversion Vary By Category? (Yes!)
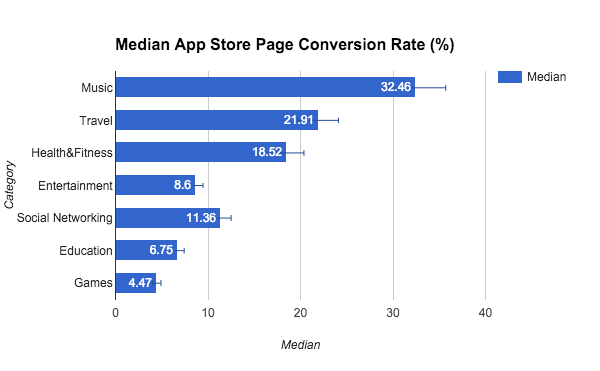
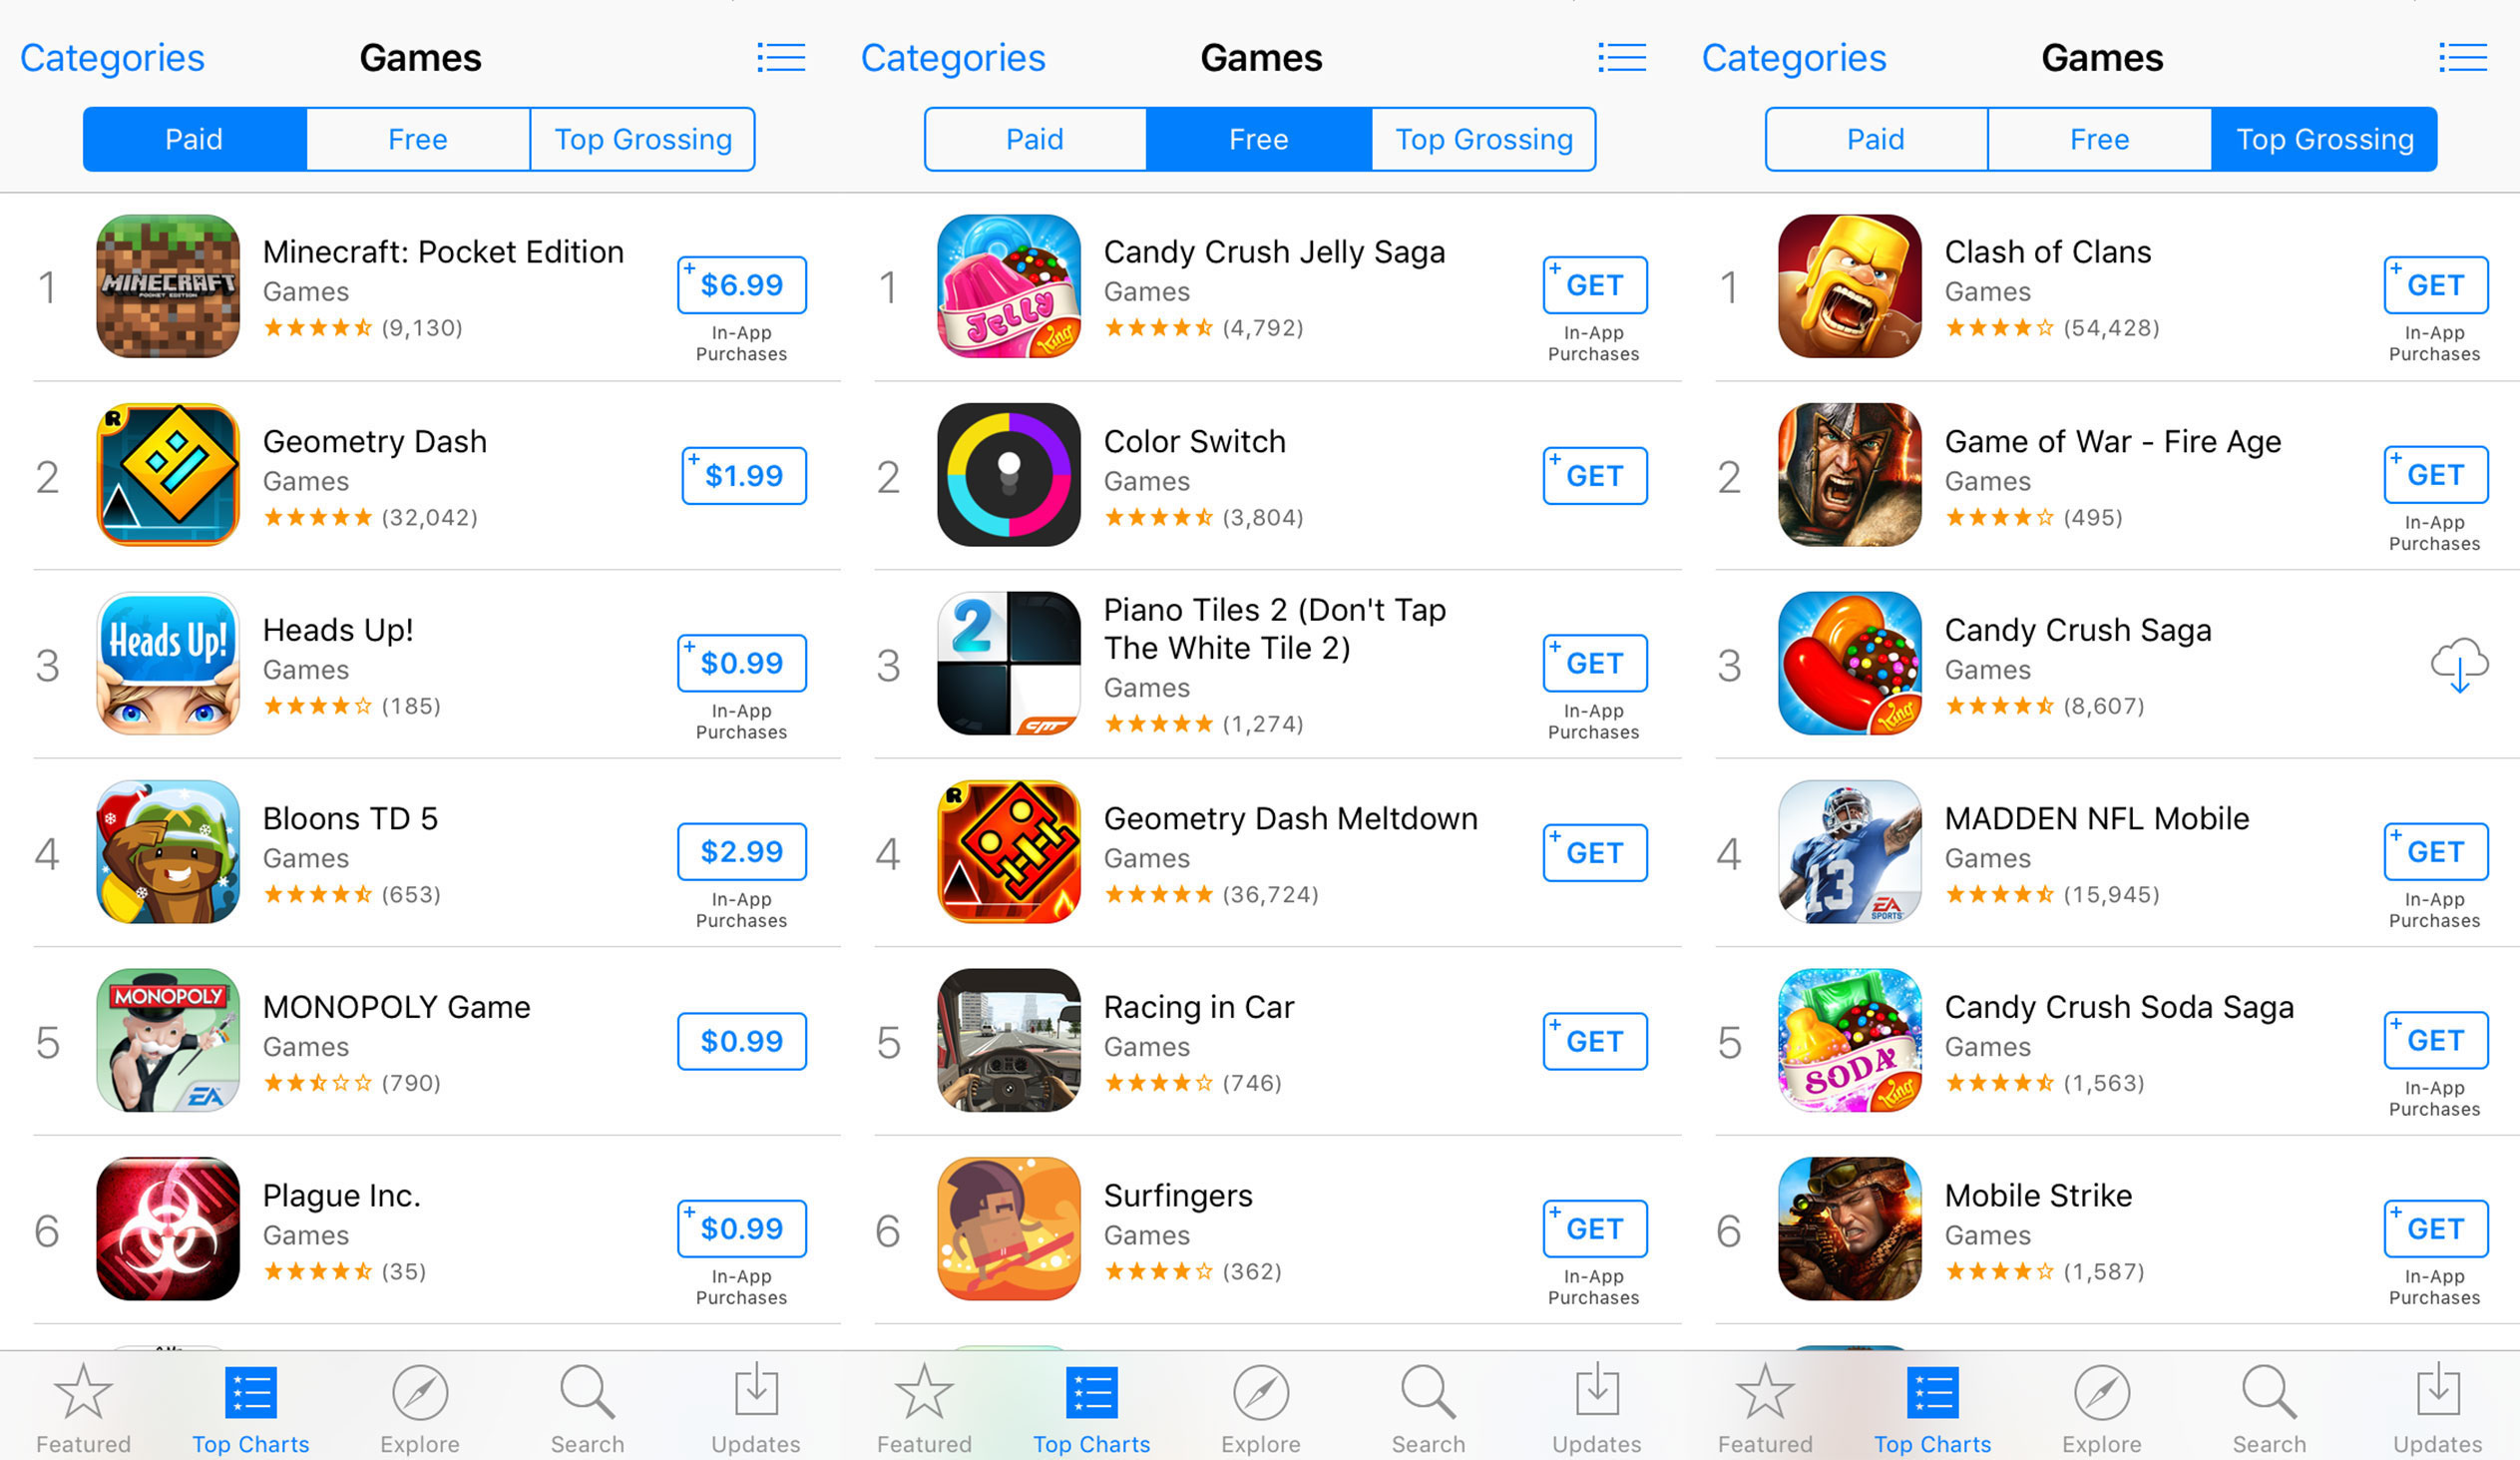
Smartphone game apps are growing at explosive rates, eating up a huge chunk of the time people spend on public transportation, in lines and airports, and virtually anywhere – despite being a major battery hog. With so many choices available to provide immediate gratification to a smartphone user, apps in Games category show the lowest conversion rate, with the median conversion of 4.47% and the largest discrepancy between the highest and the lowest value (78.33% vs. 0.87%).
What does it tell us?
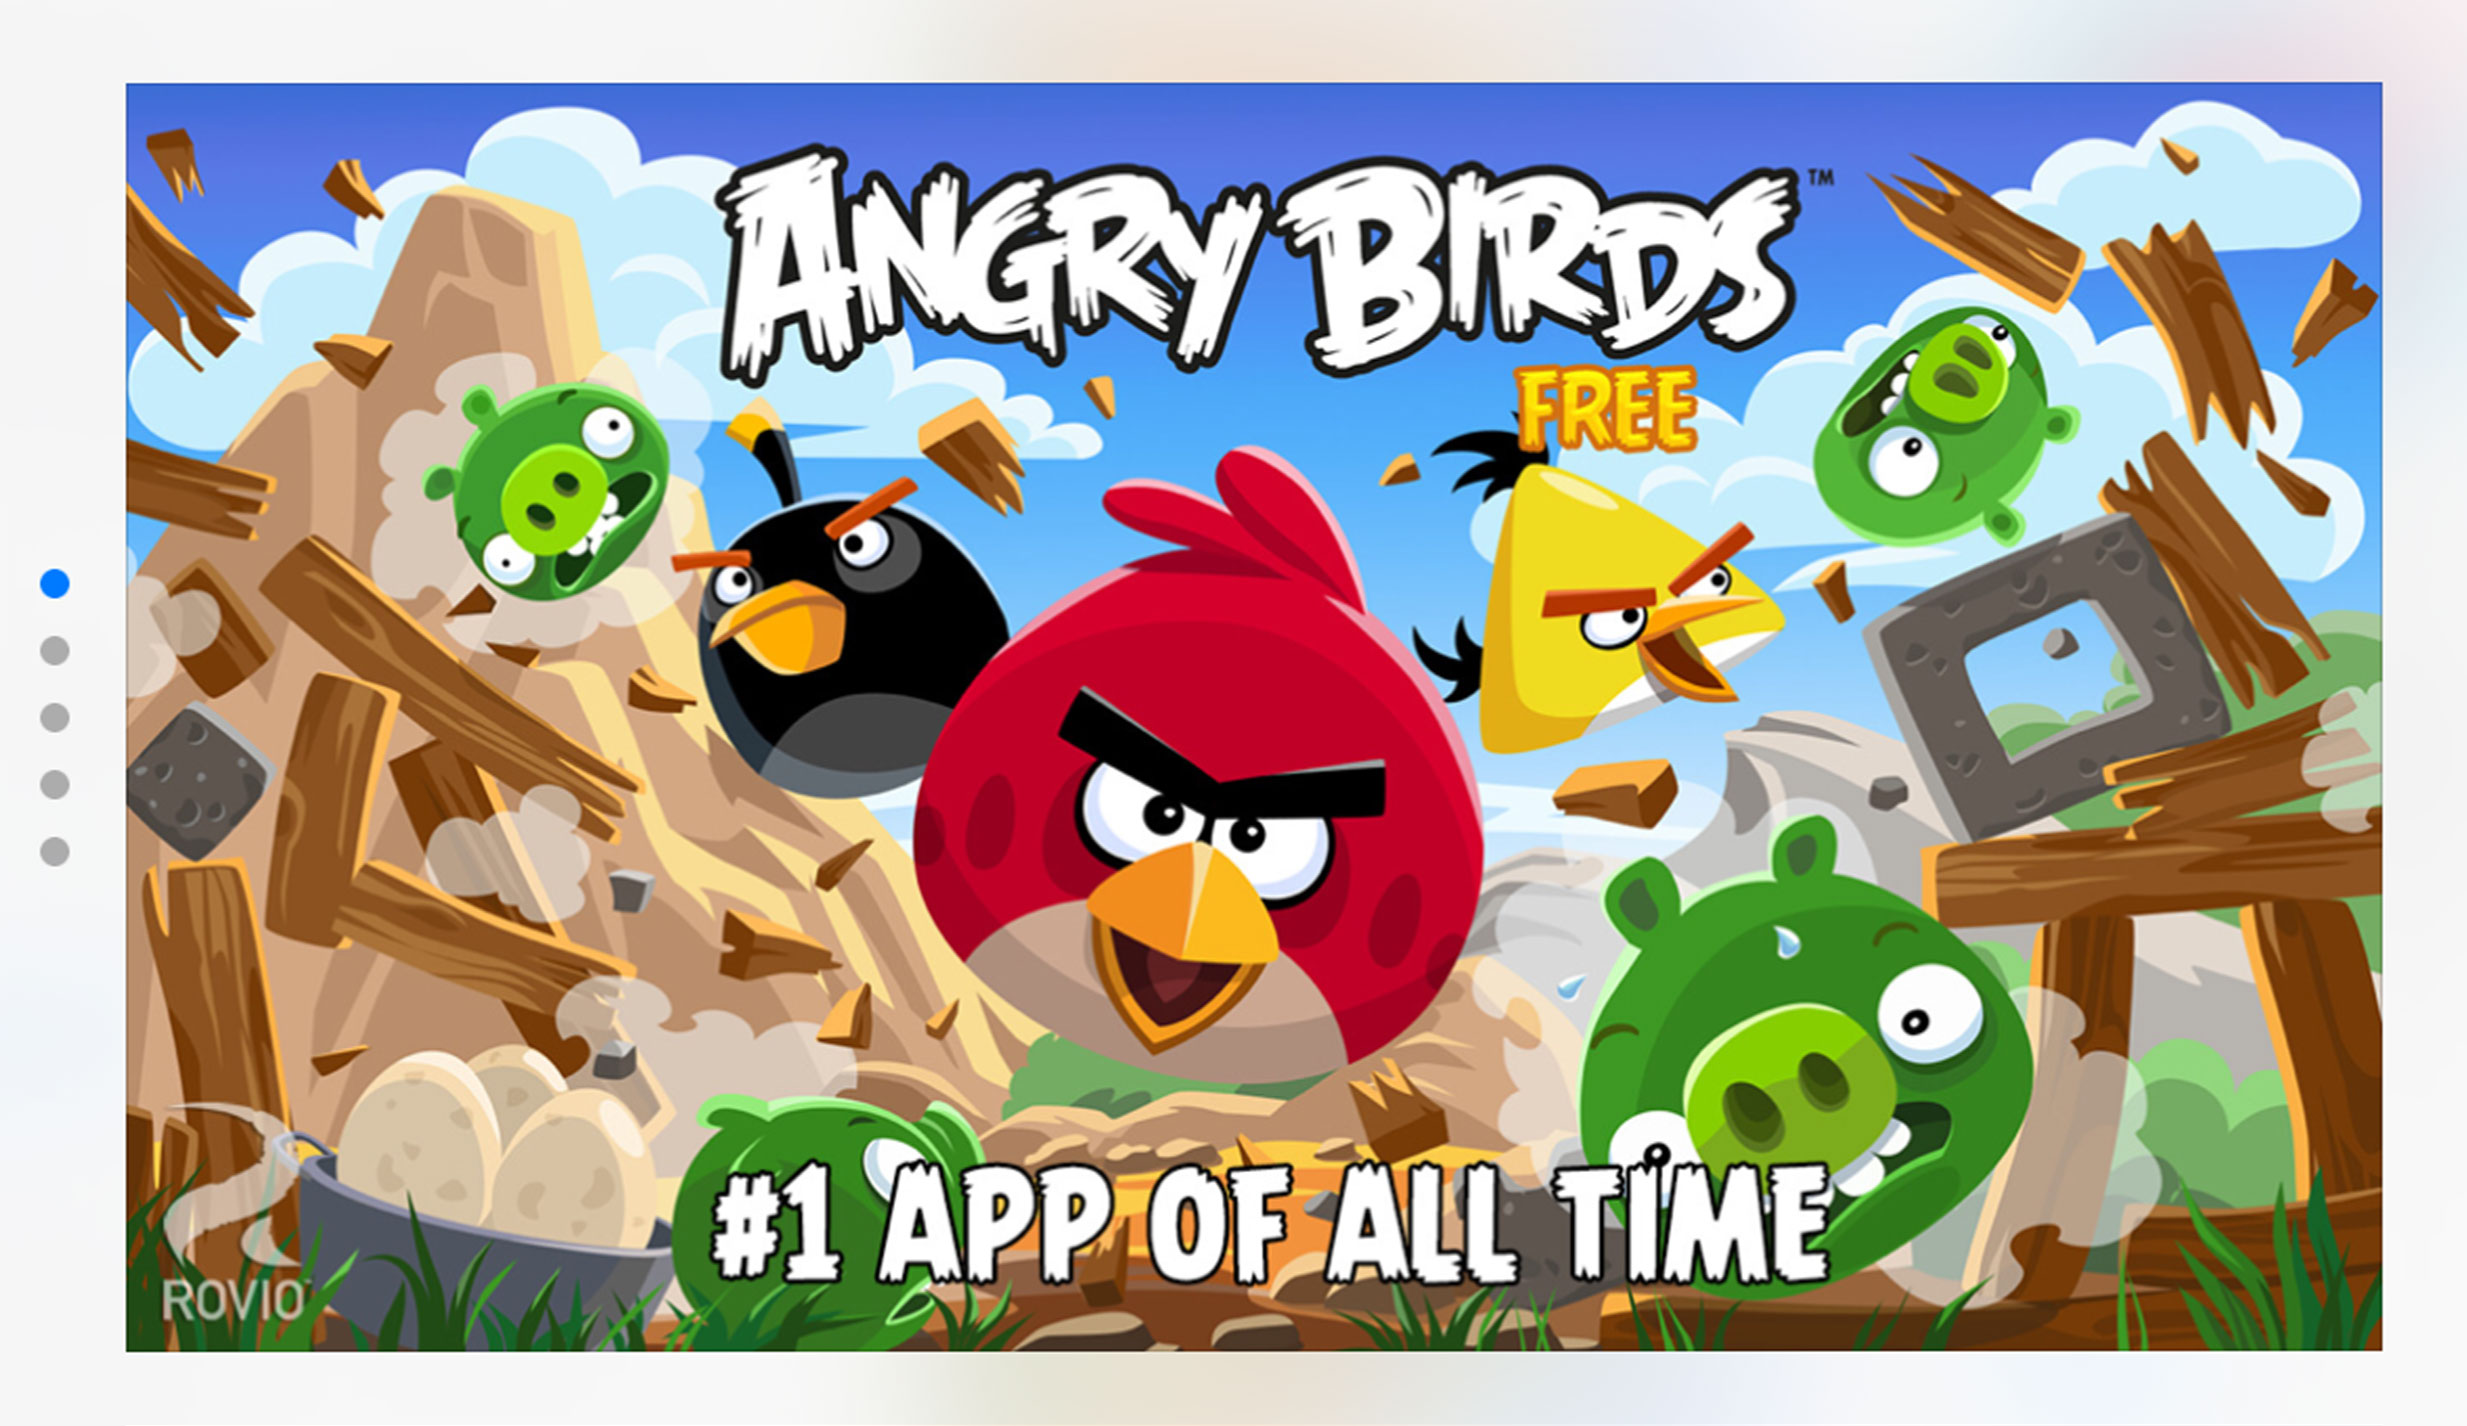
Well, people like different games. Also, the difference between a high-performing and a low-performing app store design can be very drastic, and it pays off to focus on optimizing app store conversion to save big on your ad campaigns. For example, Rovio’s Angry Birds managed to increase its conversion as high as up to 30% by optimizing screenshots.
Learn all the latest App Store Optimization trends for icons and screenshots (colors, styles, best ideas for art, orientation) on the App Store and Google Play Store in “ASO Benchmarks & Trends 2020. Mobile Games.”
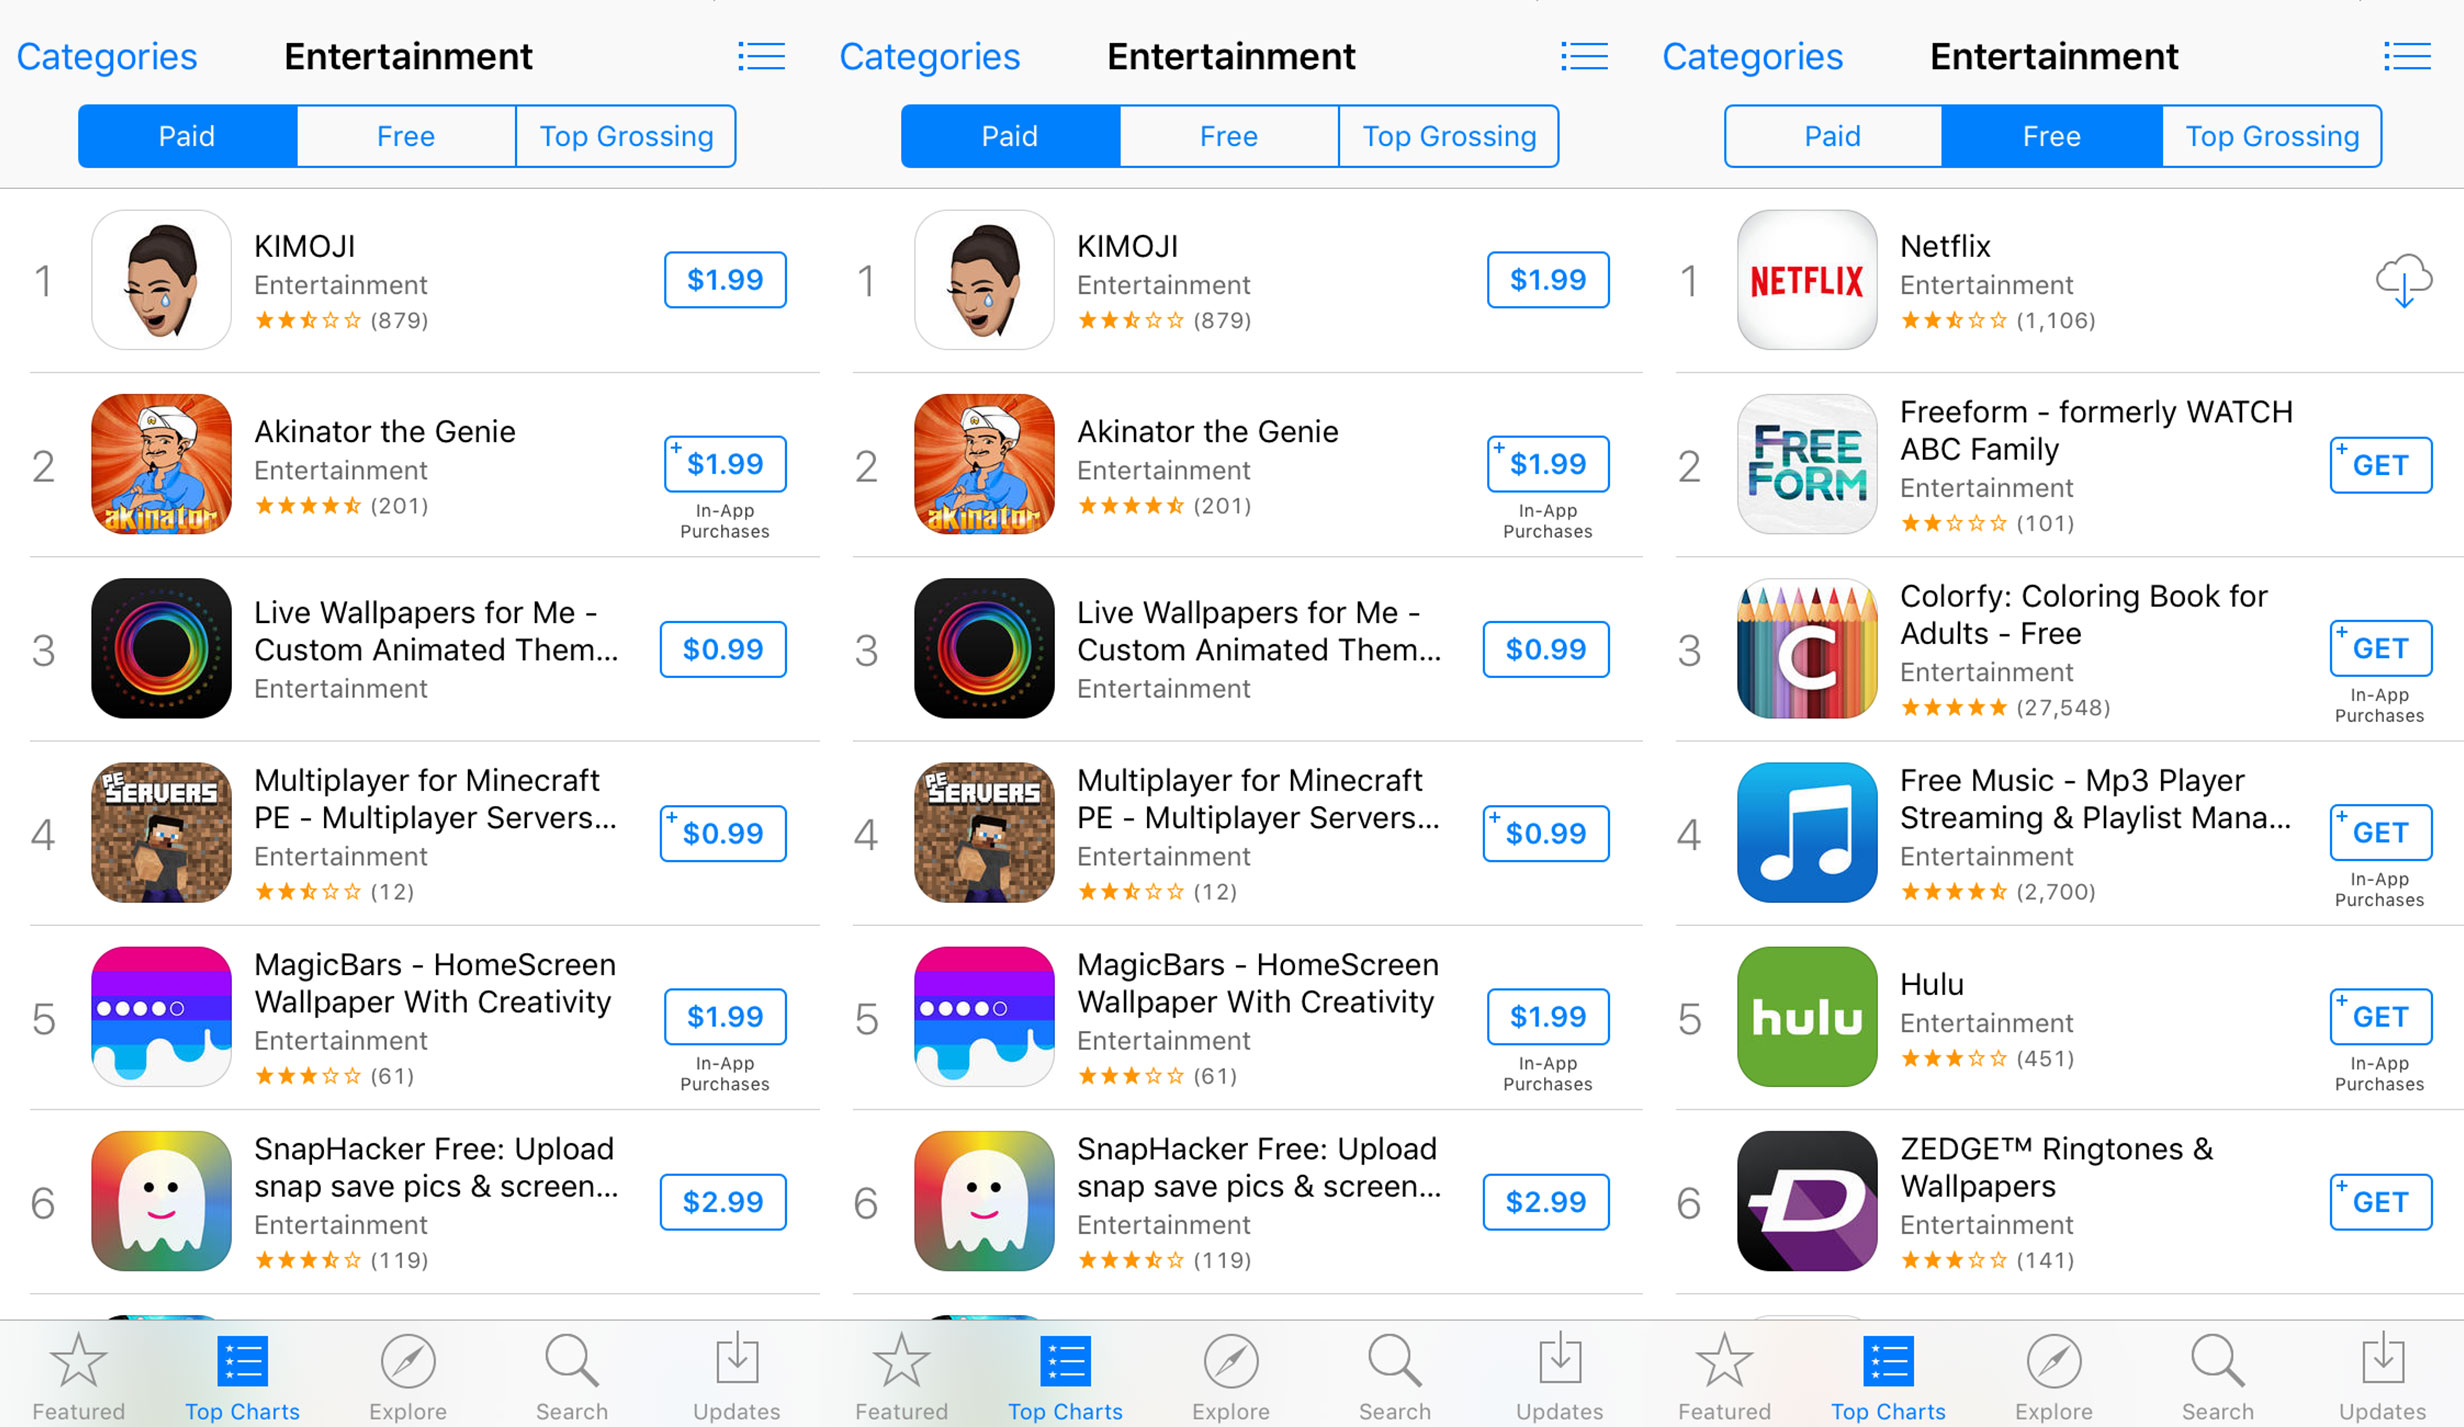
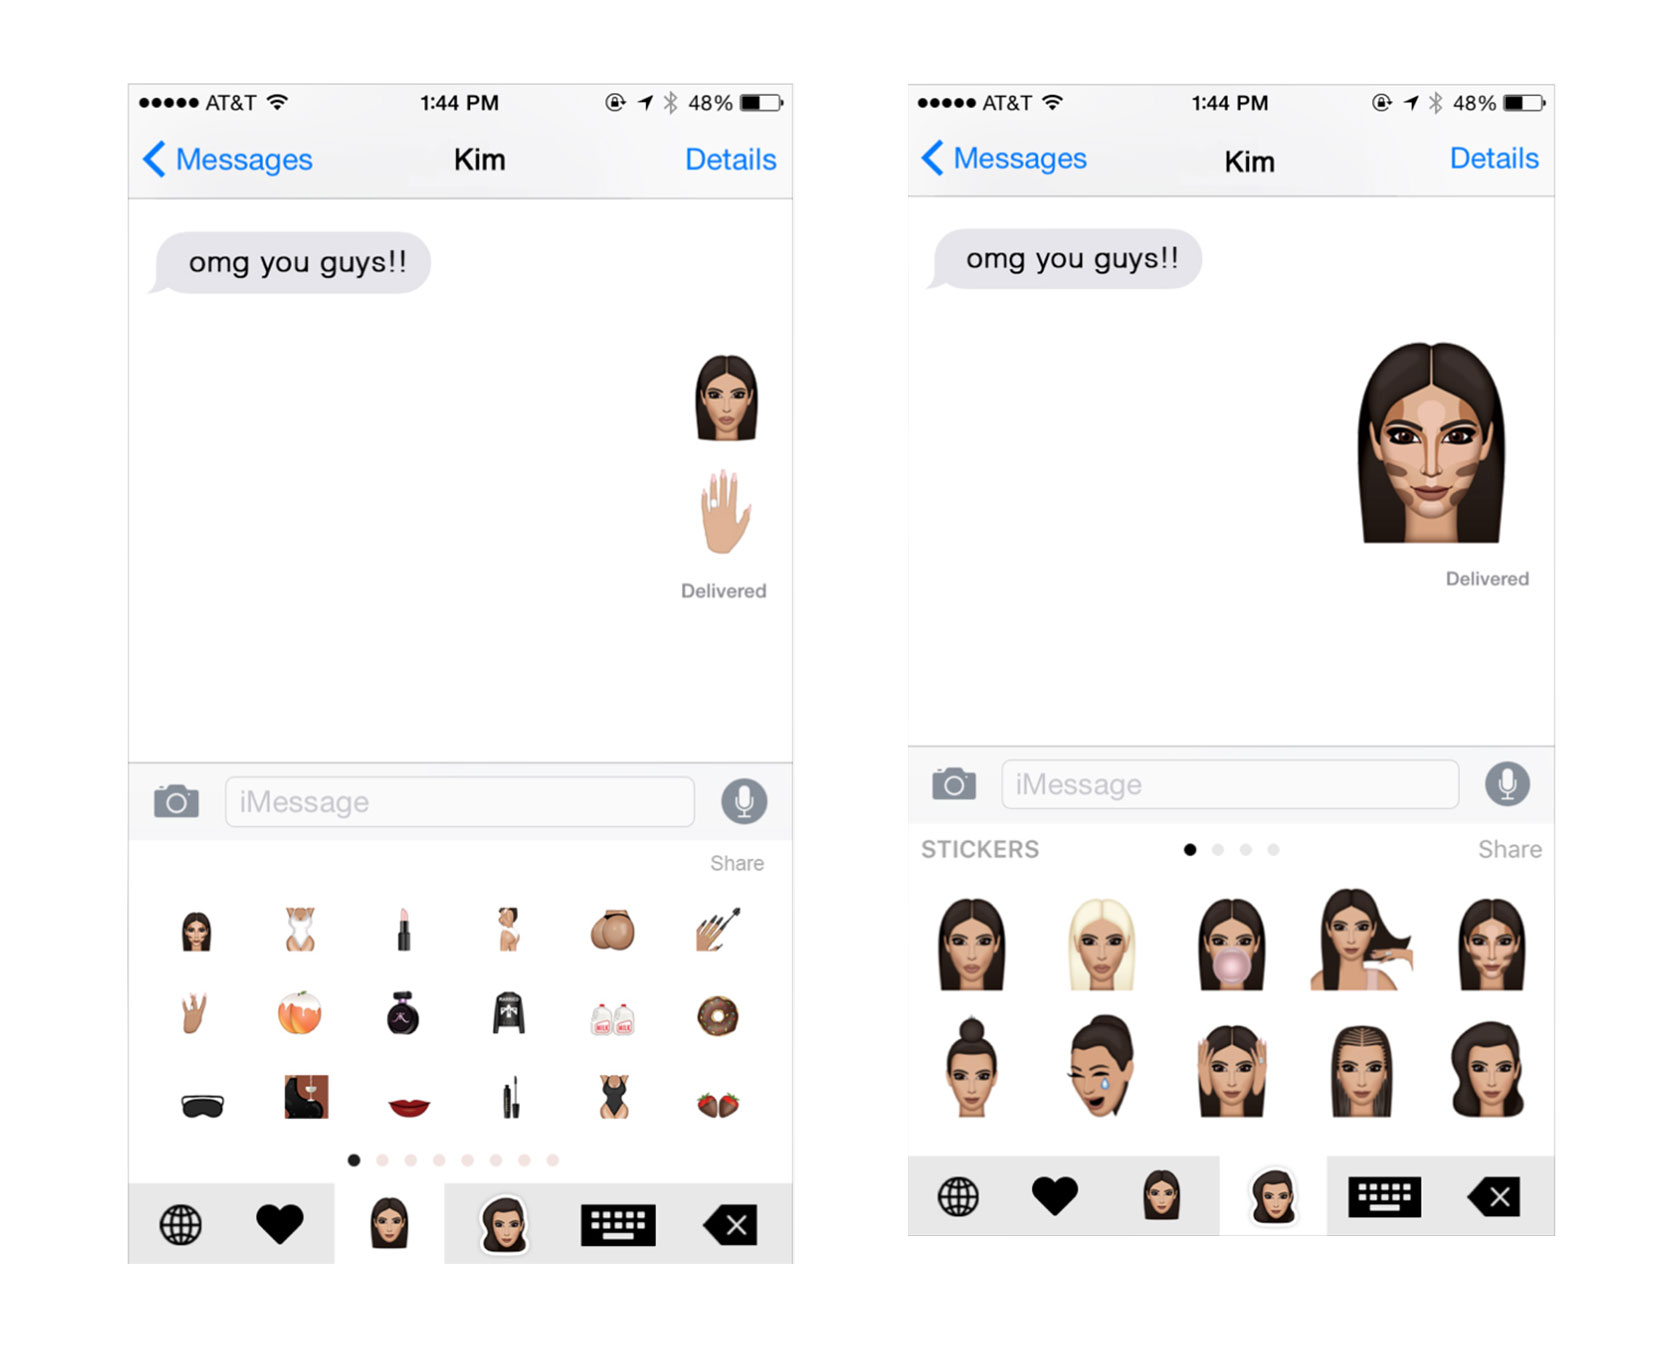
The entertainment category comprises apps with different functions ranging from selfie enhancers and pop icon emojis to video-streaming services such as HBO Now and Netflix. According to Nielsen, the emergence and rapid growth of entertainment apps is the reason we now see a big increase in the average time users engage with apps.
The median conversion rate for Entertainment is at a low 8.6%. Again, the difference between the maximum and the minimum conversion percent value is huge – 78.33% vs. 0.86%.
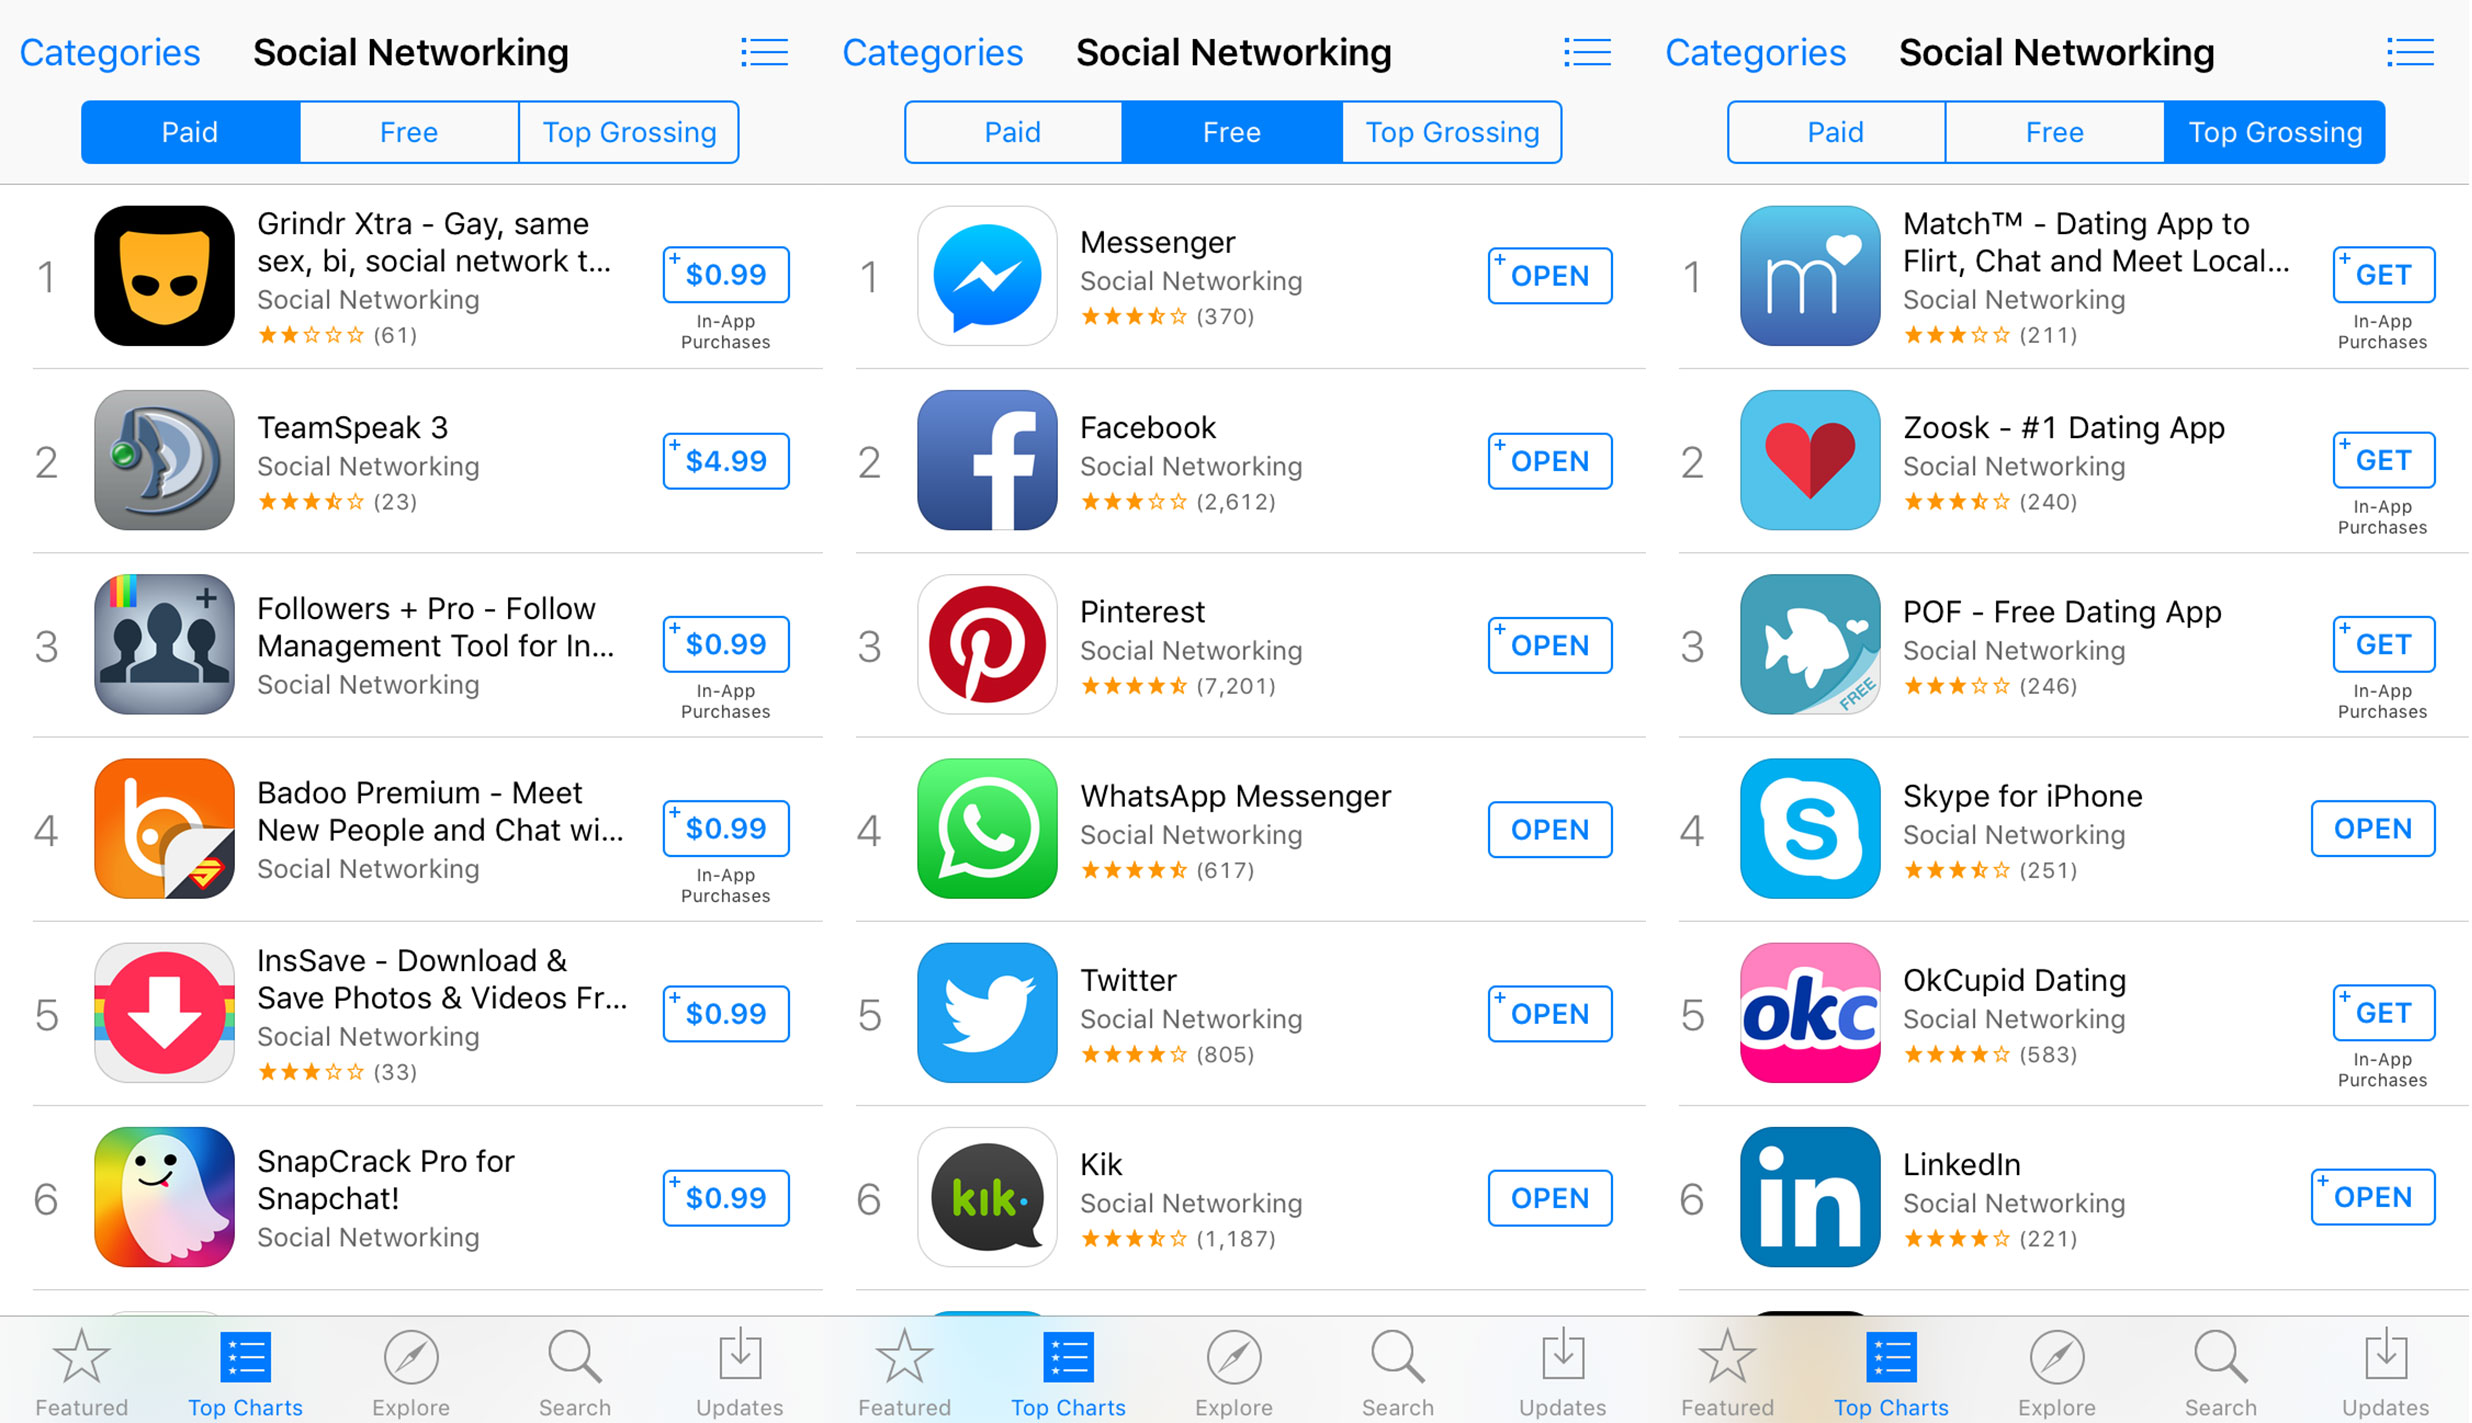
Apps in this category include messengers, social networks (with Facebook holding the monopoly at the top for as long as I can remember), professional networking apps, and dating apps. Recently, Peach broke into the free charts with its micro-content sharing and “magic words” that you text into a field to start drawing or share a location. As for all social networking apps, “the next big thing” will be as big as the crowd it will manage to retain in the next couple of months. The median conversion rate for apps in the Social Networking category is 11.36%, with the difference in conversion ranging from 81.65% at its best and 0.53% at its worst.
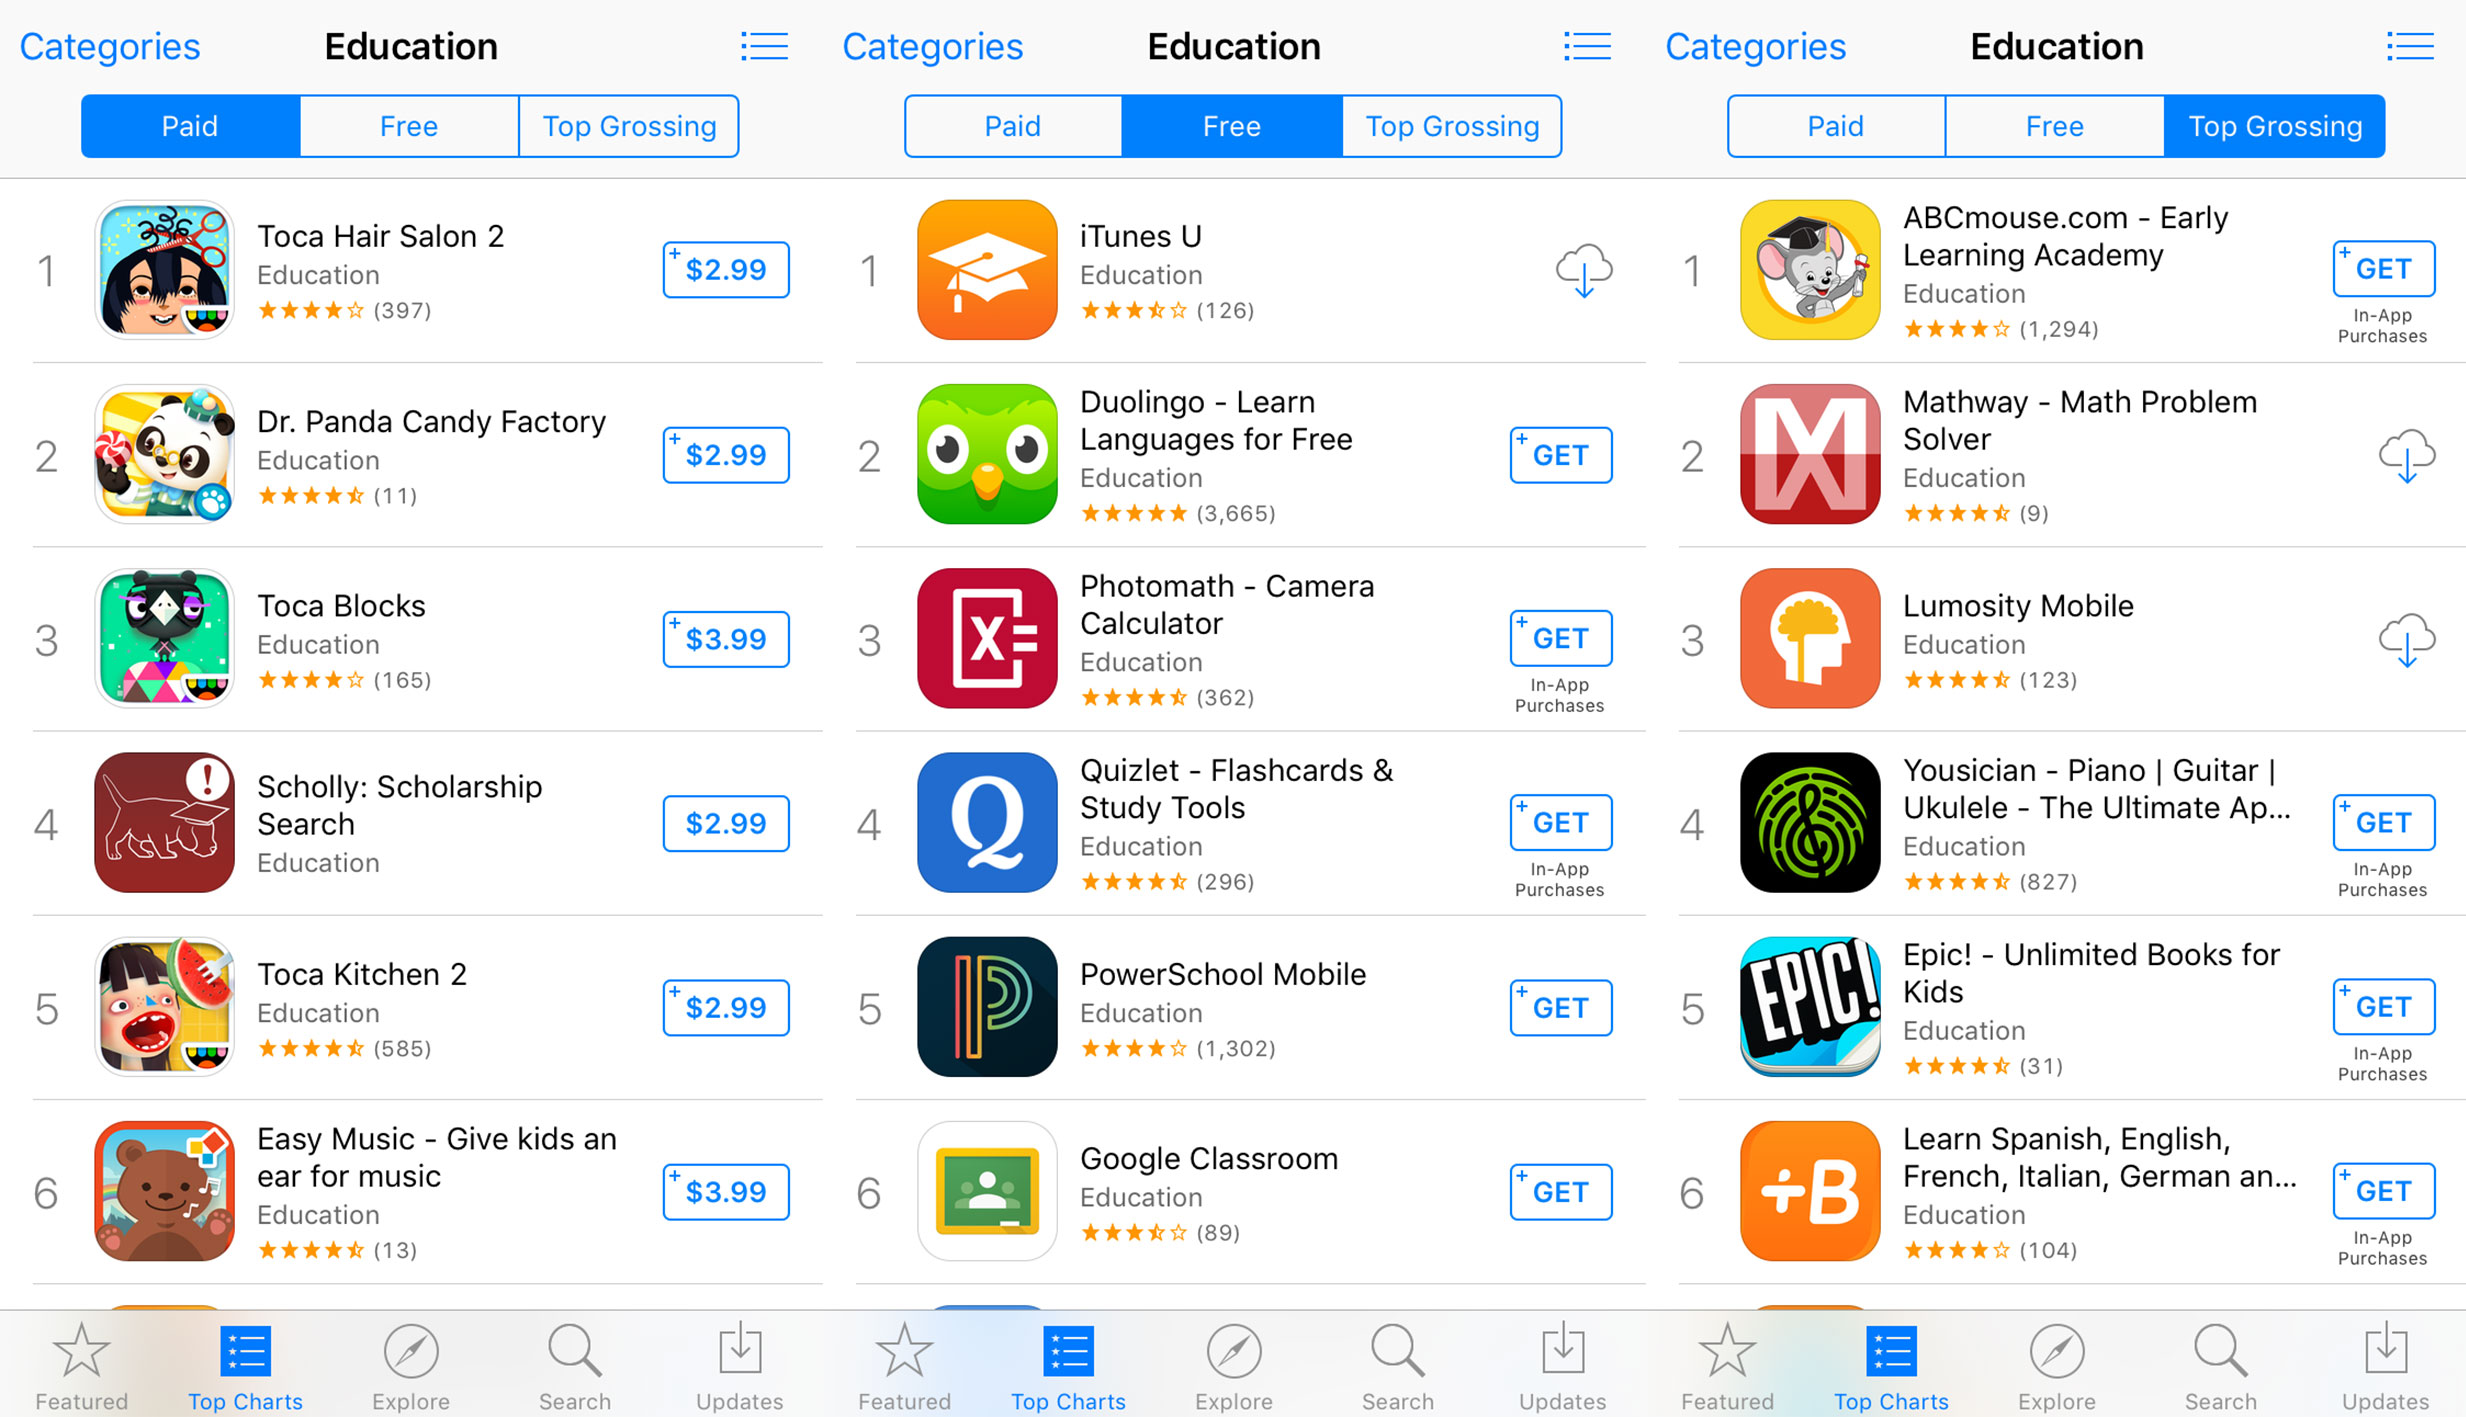
Whatever the age, it’s never too late to charge your grey cells, and the category delivers. From fun memory games to puzzles and MOOCs, education apps can fool an adult that you’re playing when you’re learning. My recent favorite is Blaze and the Monster Machines Dinosaur Rescue, a $3.99 app from Nickelodeon teaching preschoolers STEM (Science, Technology, Engineering, and Math) concepts as they travel through Dino Valley.
Despite the recent controversy with Lumosity “brain training” games (the developer paid $2 million for misleading claims about cognitive benefits), chances are people will continue buying in the brainpower-enhancing promises. Maybe because we’re genetically wired to look for shortcuts, maybe because some of the theme education apps are seriously a lot of fun.
The median conversion rate for the Education category is 6.75%, with a 44.81% maximum conversion rate and 1.93% at its lowest.
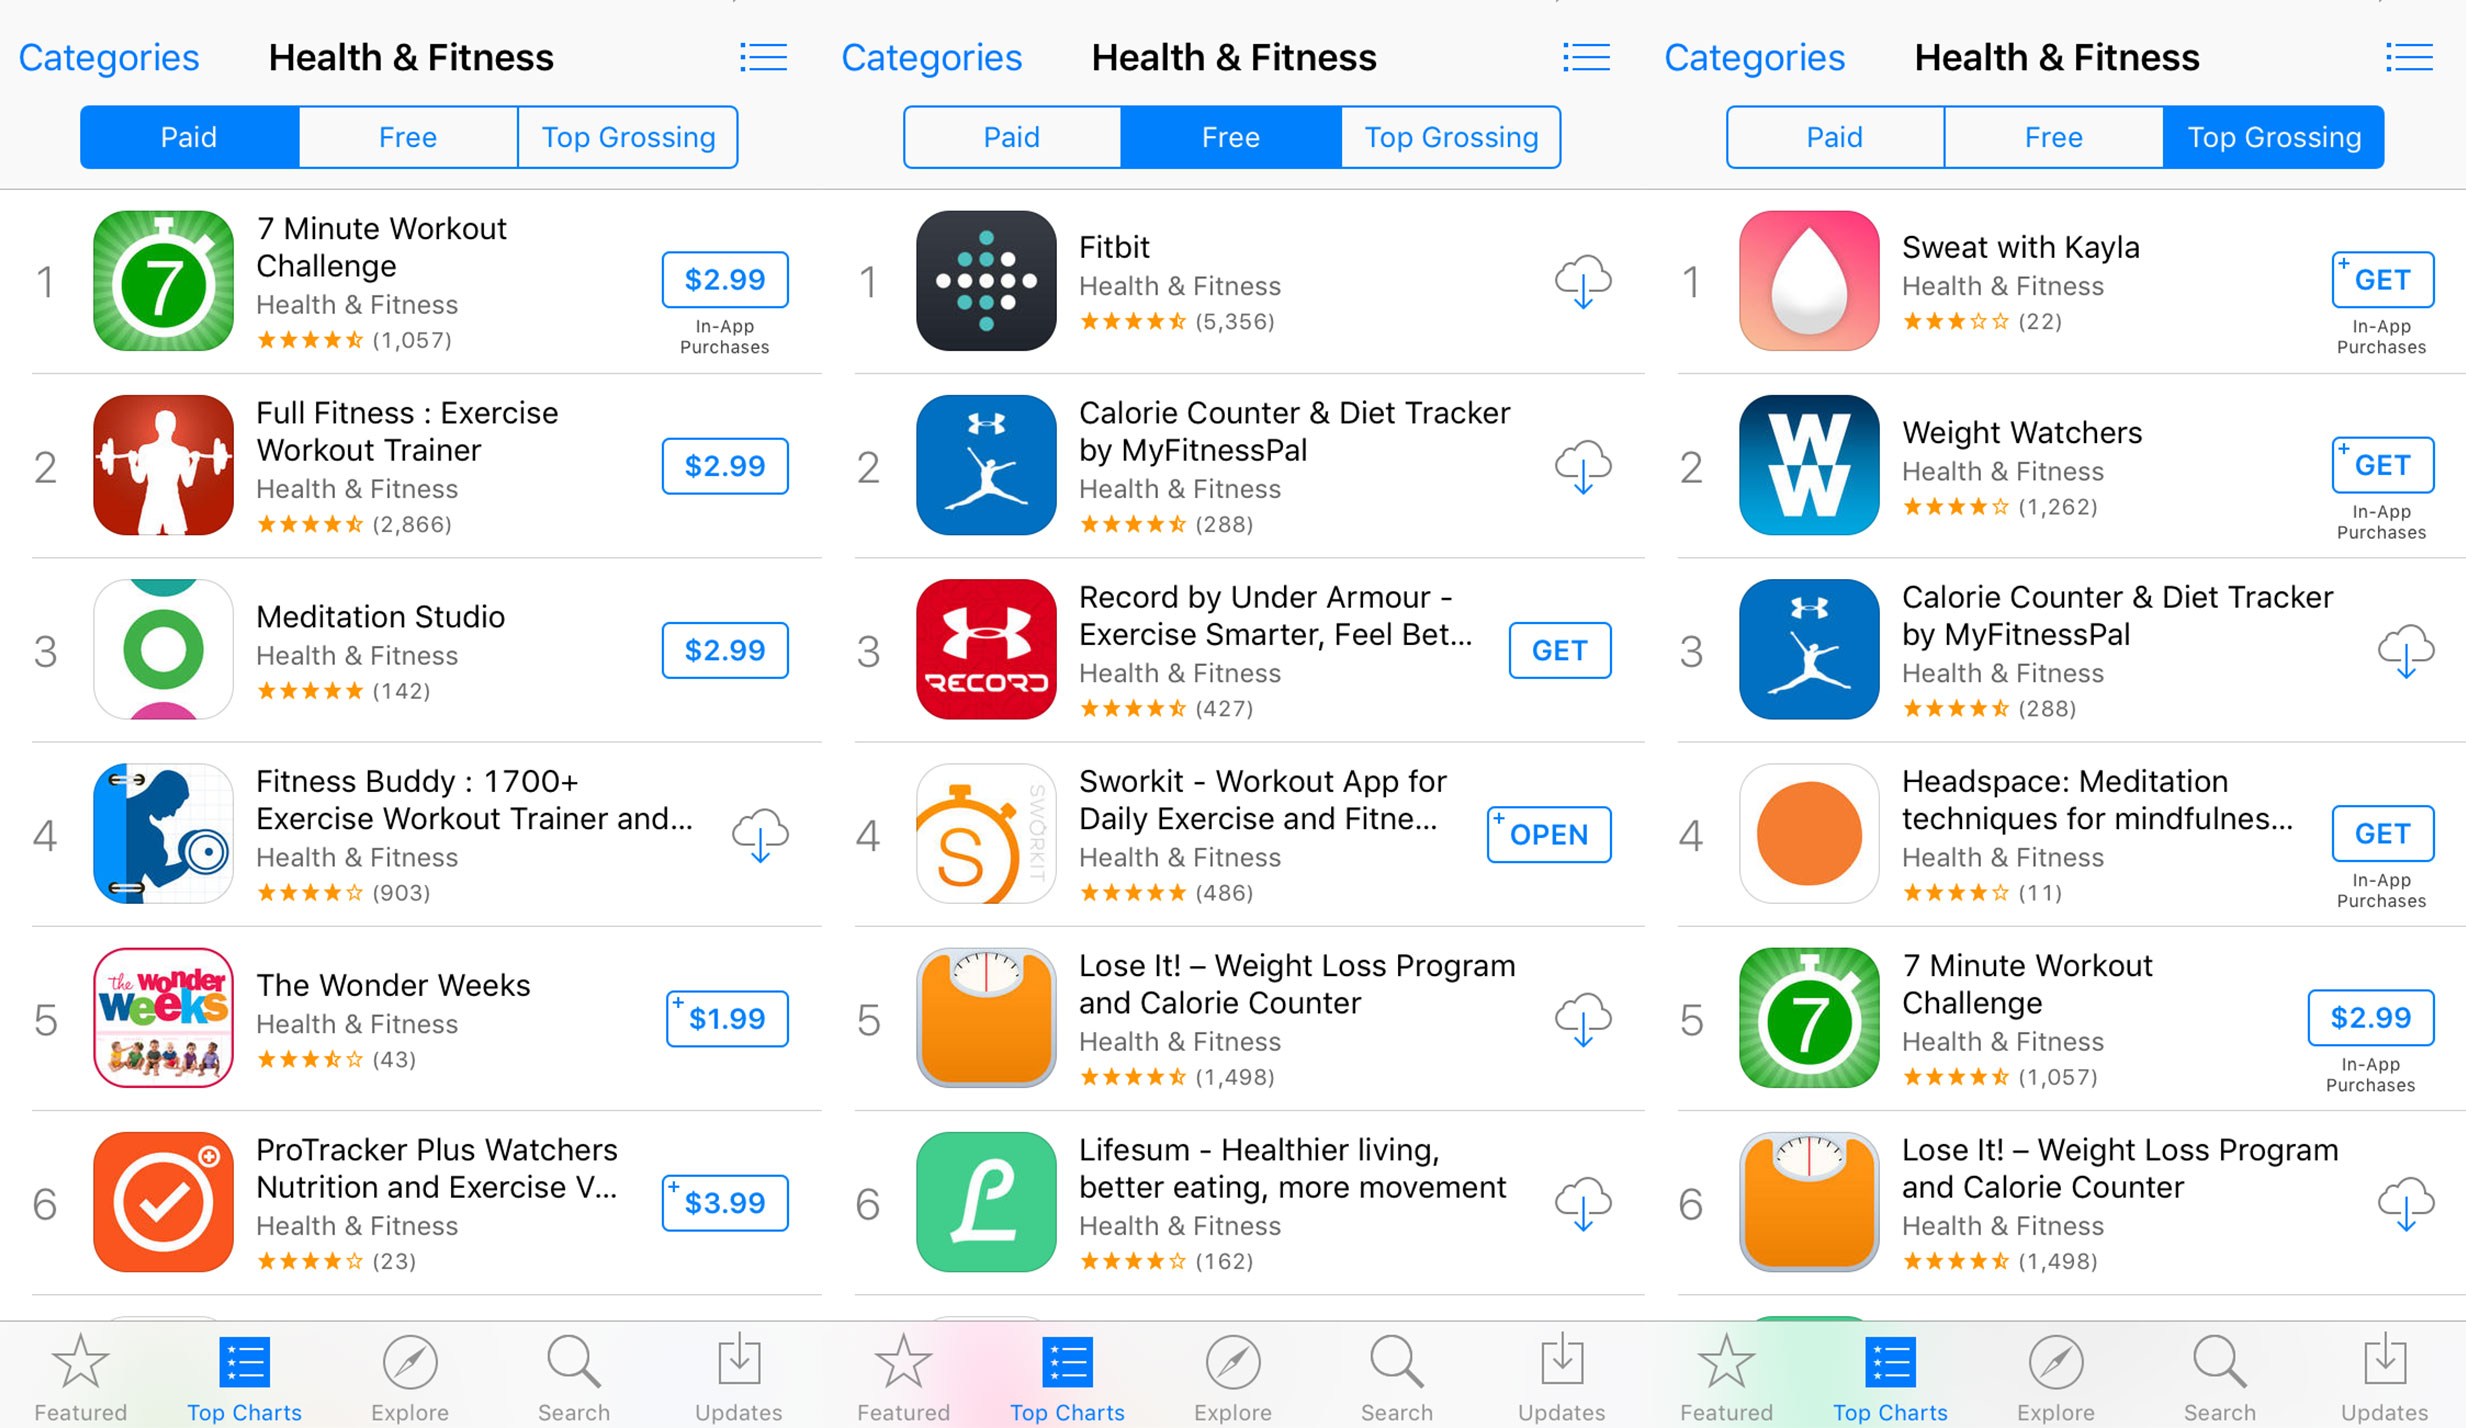
Fitness novices and experts use apps to track and plan workouts, look up exercises, take gym selfies, or indulge in moments of zen with meditation sounds. The health and wellness movement has been making trends in the last couple of years, and health & fitness category publishers are riding the wave.
For example, the new Sweat With Kayla app, released by a famous fitness guru Kayla Itsines earlier this month, became number 1 grossing app in less than a week despite the fans’ criticism for being “too expensive”. And subscription-based health and fitness apps seem to be the ones cashing in most with every new year resolution season and beyond. The median conversion rate for the Health & Fitness category is 18.52%, with a difference across apps ranging from 57.68% to a low 0.94%.
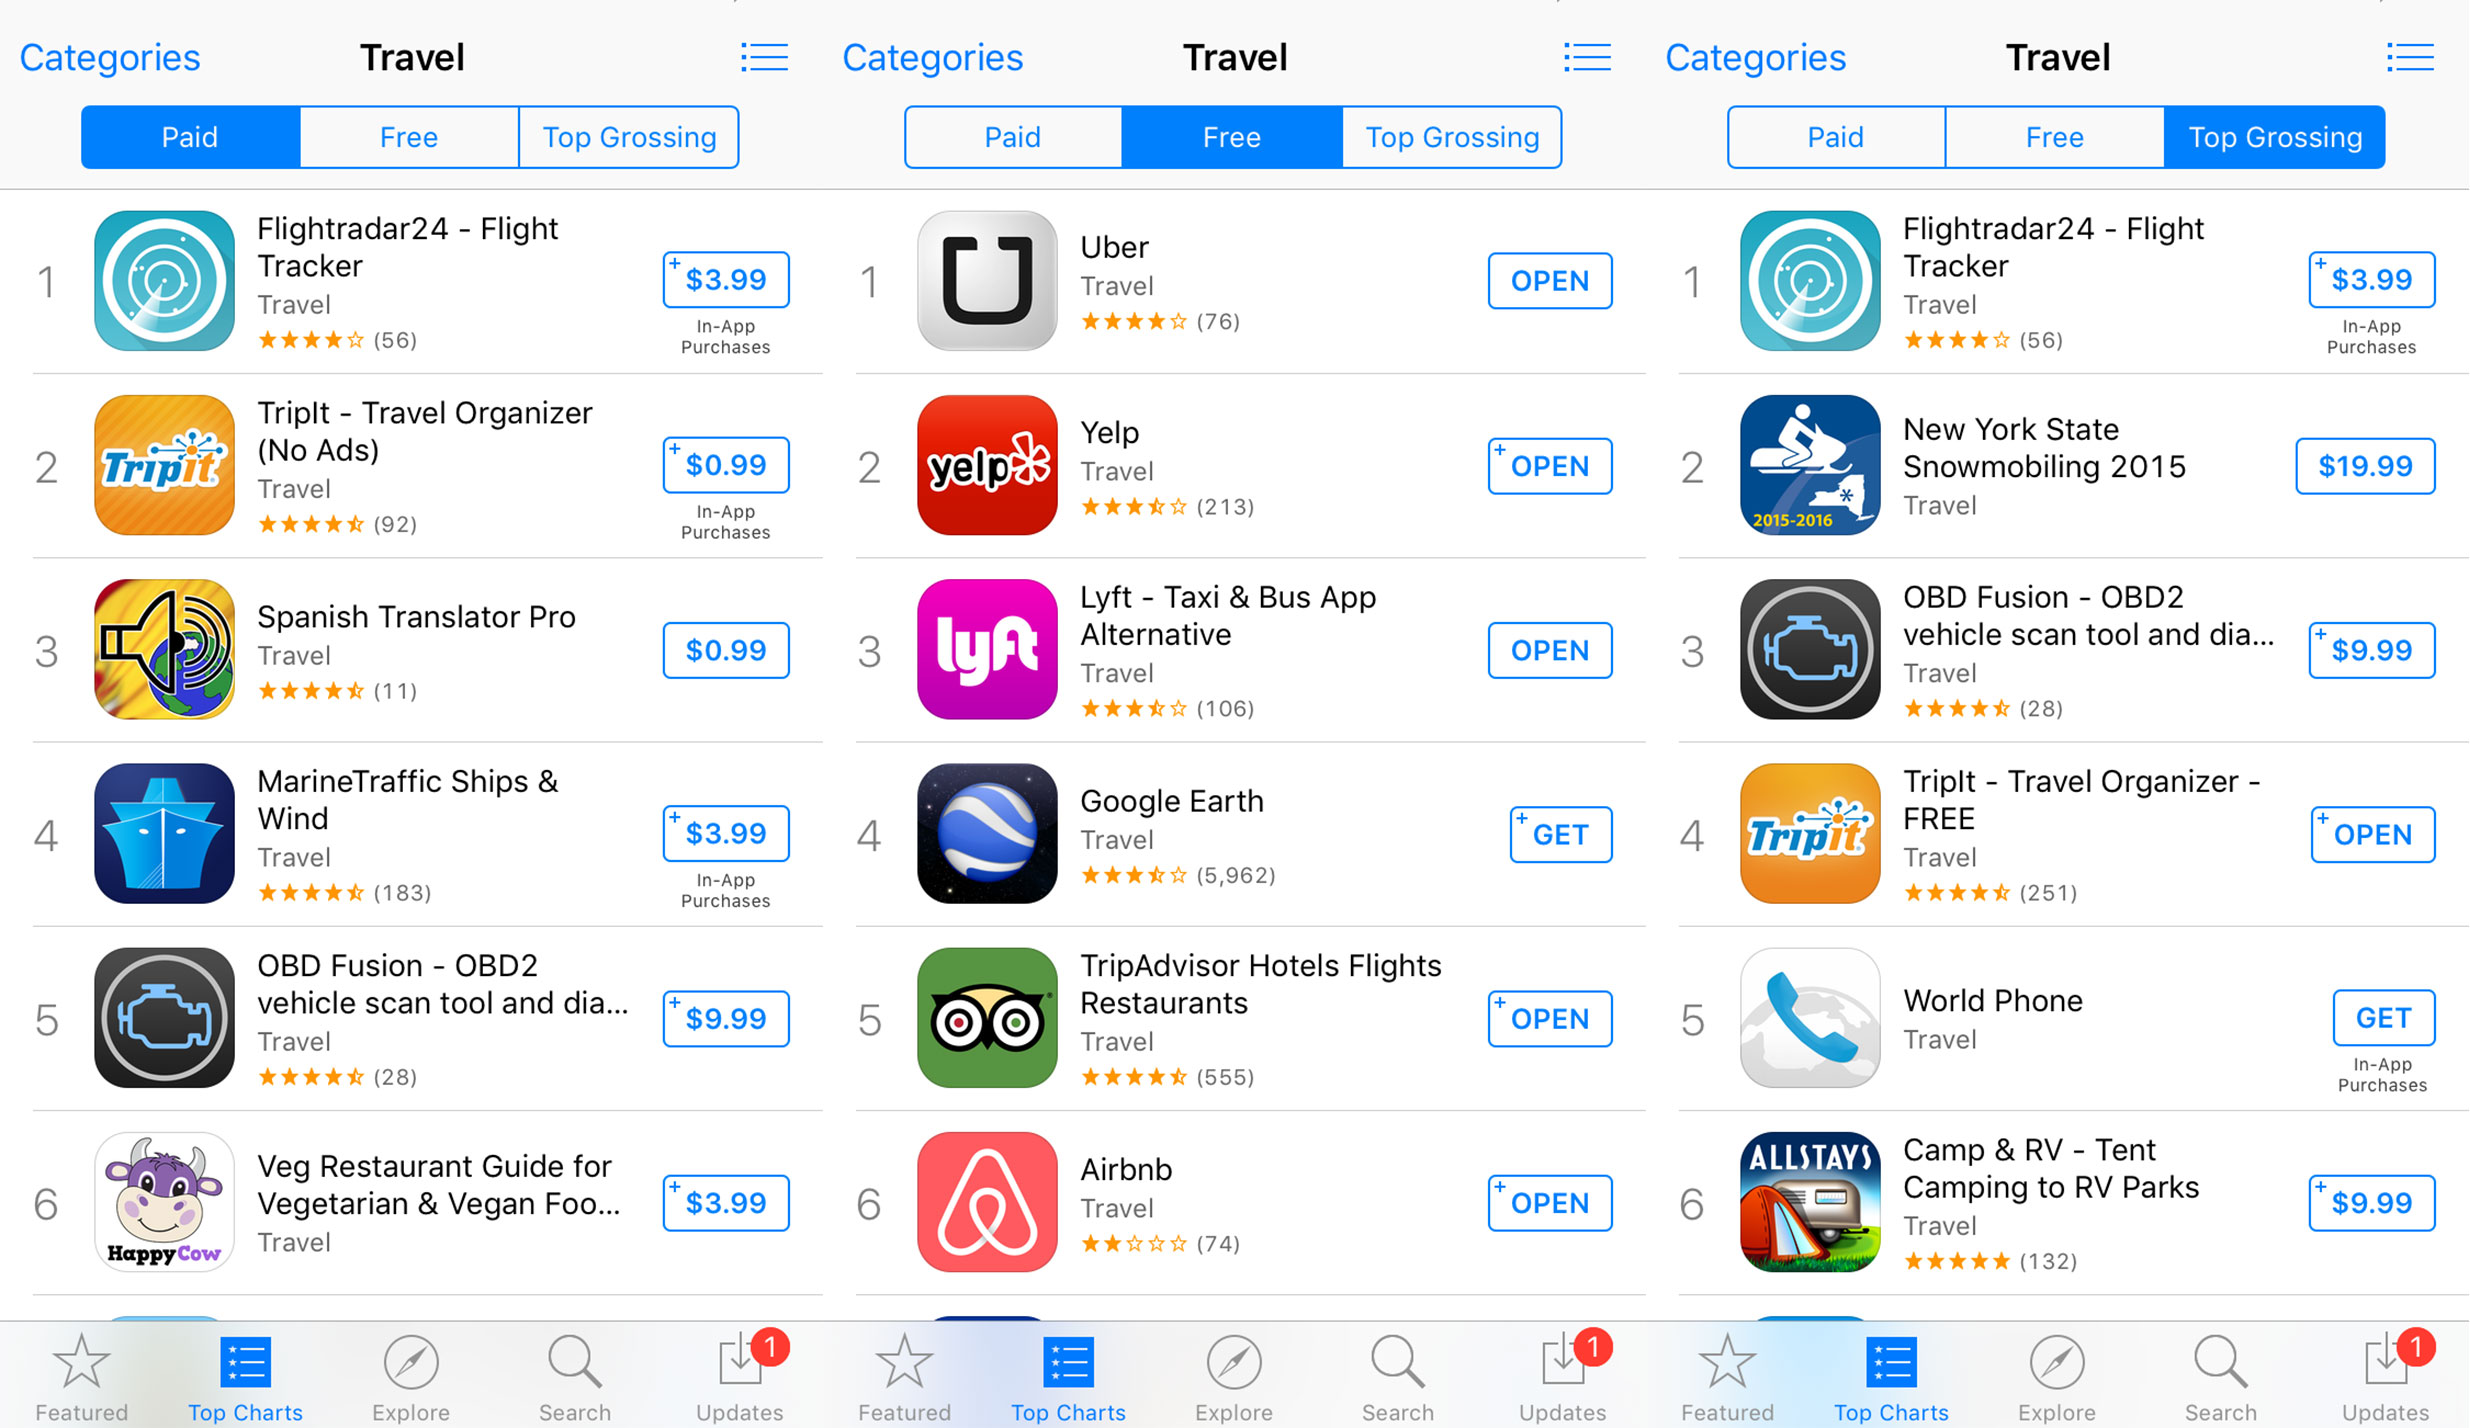
Travel apps help mobile users explore and get around with clear directions, whether it is exploring the new terrains or driving to a local supermarket. The category also includes taxi service apps, hotel booking, language learning and wifi spots tracking. From weekend trips to summer vacations, apps keep travelers sane with reminders, organized itineraries and fast lodging search that also helps save the buck.
The app download rate is pretty high, at media 21.91%, with maximum 66.1% and minimum 3.86%.
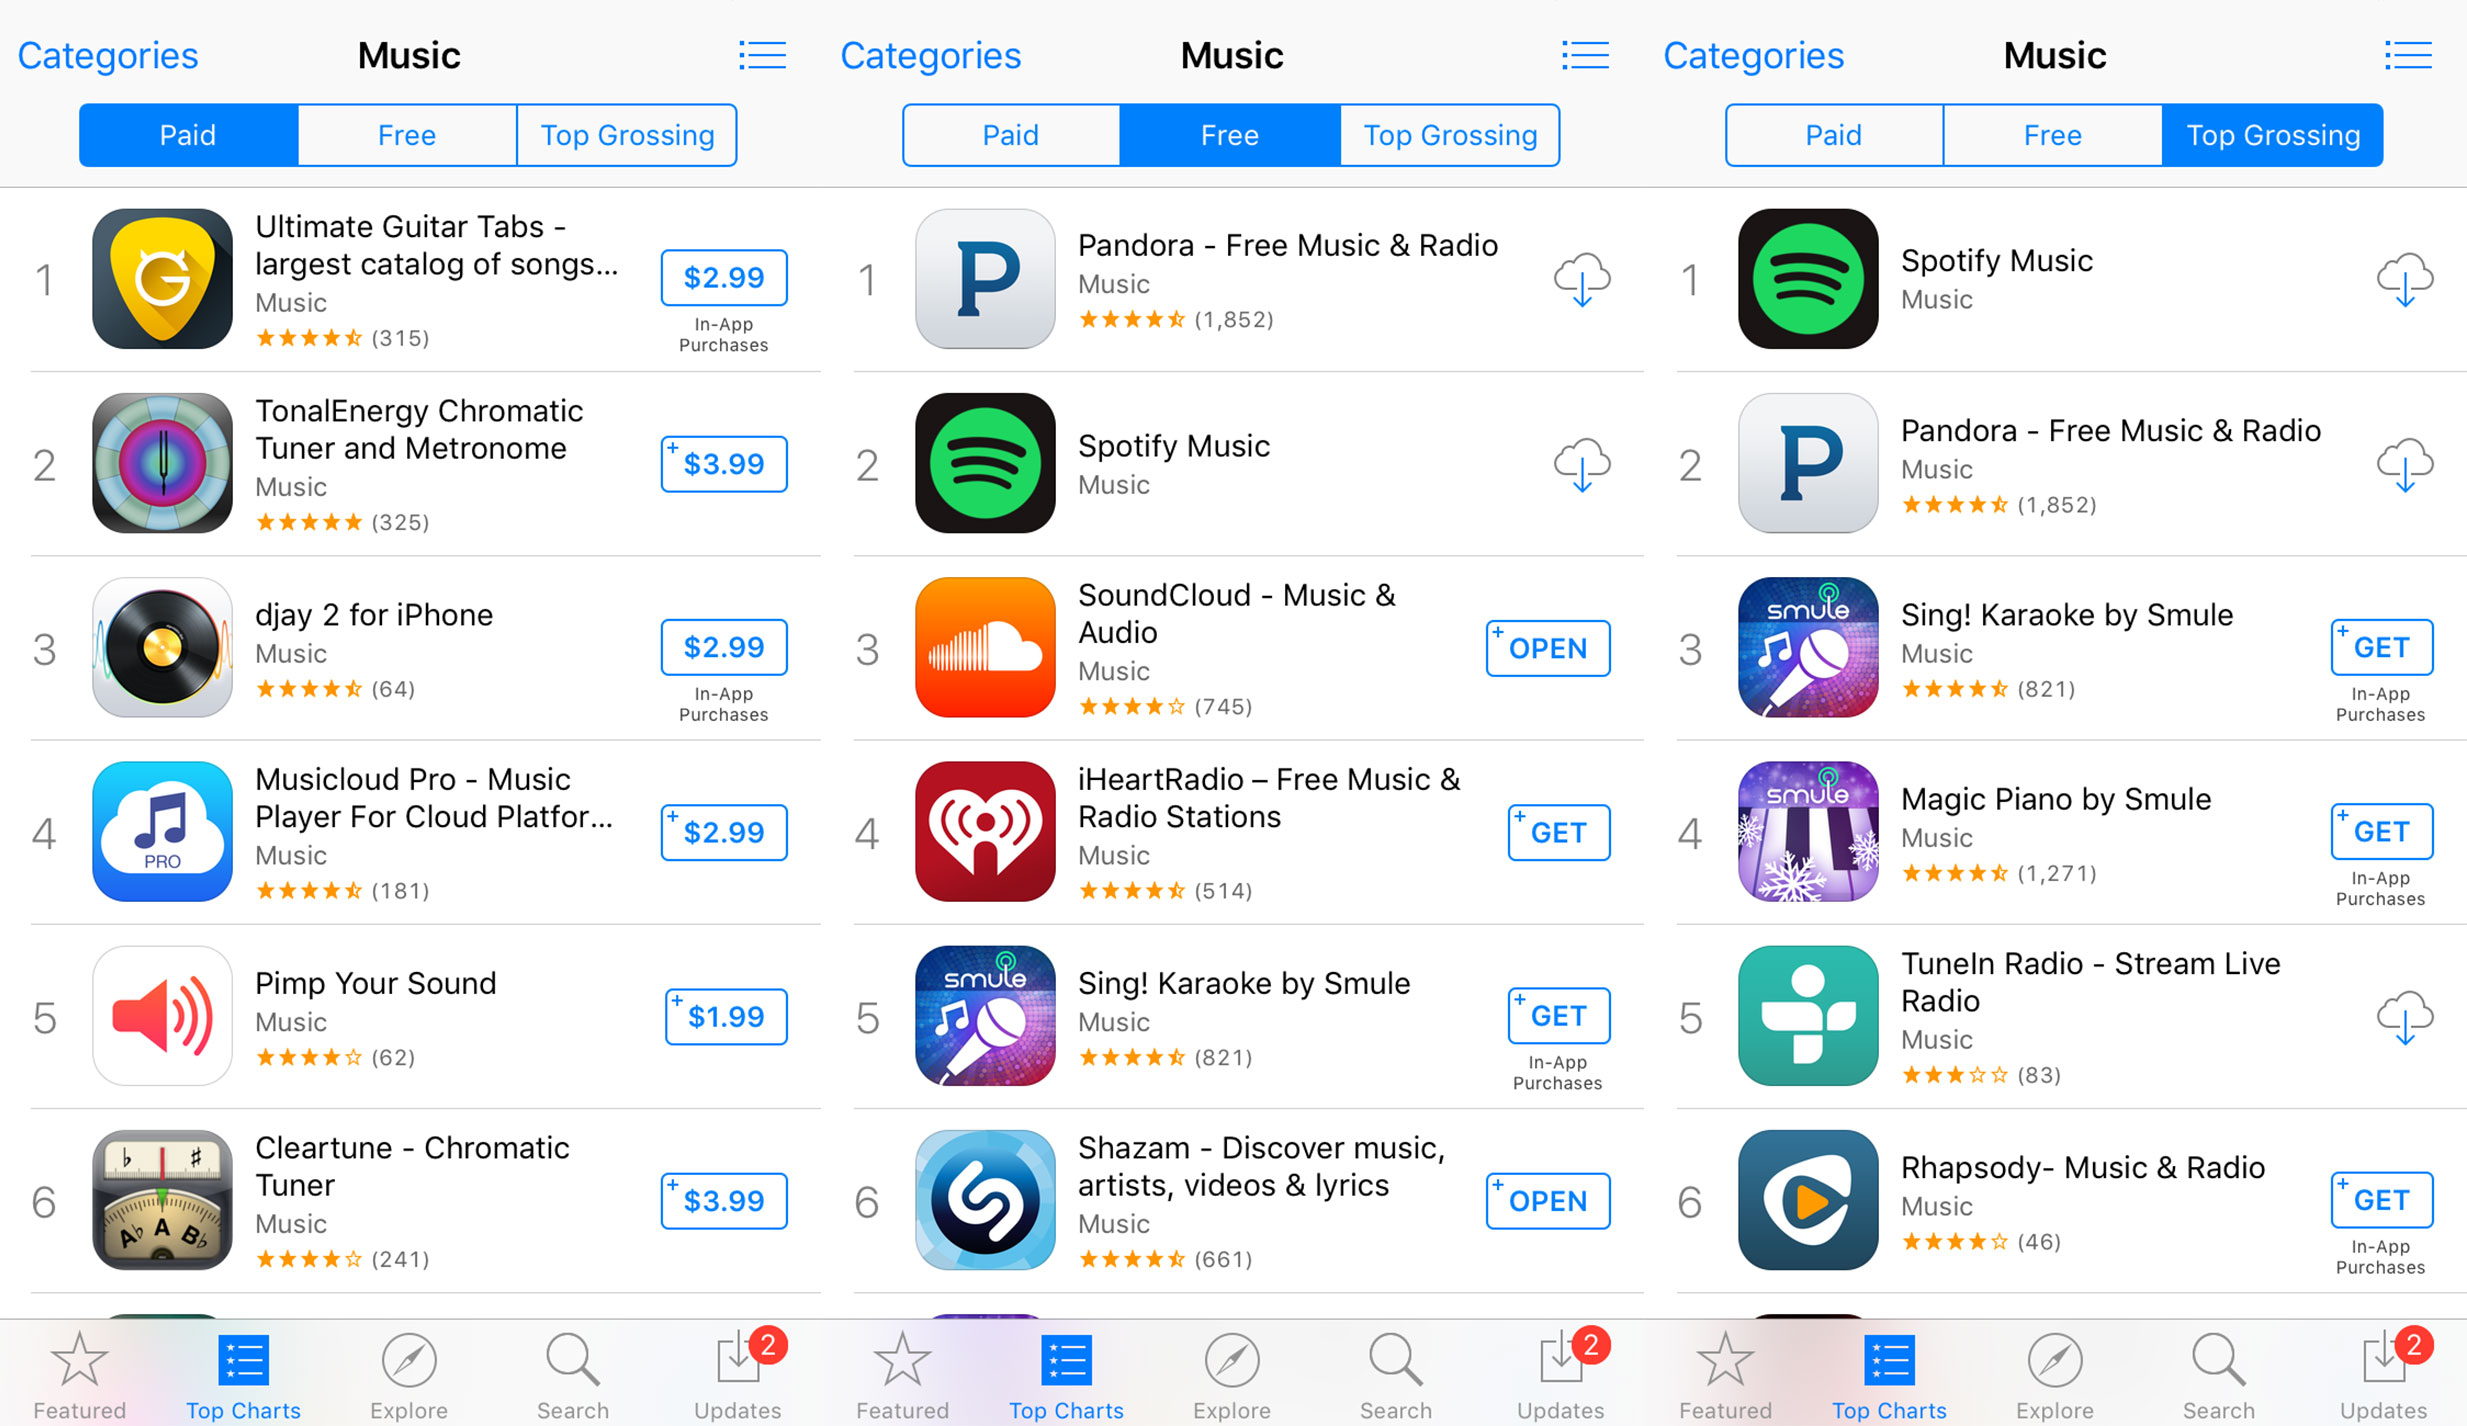
A clear winner in the dicey game of app store page conversion, Music category features a whopping (compared to others) median value of 32.46% and the highest of all categories minimum median of 4.91% (the highest is a modest 53.57%). These are apps that offer music and video streaming, radio, metronomes, and more. The audio-only content is here to stay – YouTube’s recent official YouTube Music app with the audio-only mode is a proof.
The average install rate across all the apps that we have tracked is 26,4%. Obviously, the data comes with extremes. The highest conversion rate we tracked for games was 81.71% and the lowest – 0.36%. Why such a big difference? The major factor in determining the rate is the source of traffic. Why should we care so much about optimizing conversion?