
A rebranding of an app always entails certain risks. Mindless changes normally result in conversion flops and publishers have to deal with such unpleasant consequences. However, when it comes to optimizing app, there is no such thing as unsolvable problems. Hobnob learned this bitter lesson.
Hobnob is the app that helps people to create professional-looking event invitations and distribute them via text message.
Ashwin Kiran, Growth Engineer at Hobnob, agreed to share the whole story.
When we first started using SplitMetrics for app optimizing, we had an iOS app in the store for less than a year and had just started developing our Android app.
We just rolled out a major rebrand, and the updated look was affecting the conversion rate of our iOS app in a negative way. We needed insight into how to fix this, and we needed to take app optimizing action quickly. Incidentally, this is what first lead Hobnob to SplitMetrics.
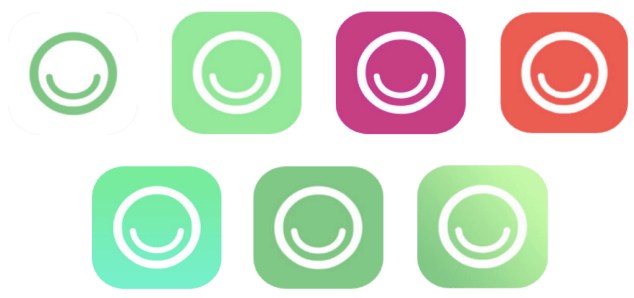
The first thing I did in app optimizing was an icon test. Apple wasn’t reporting the number of search impressions Hobnob was getting yet. So I wasn’t certain which step in the search -> product page -> download funnel was affected the most by our rebrand.
I decided to start app optimizing with an icon test because it’s the only graphic asset that’s shown in both the search results and on the product page, so optimizing this would have a positive effect on both steps.
At the end of this app optimizing test, we found an icon that performed 64% better than the rebranded one. This icon was much brighter and had a much greater depth than the rebrand one. It was also clearly more conspicuous and dynamic.
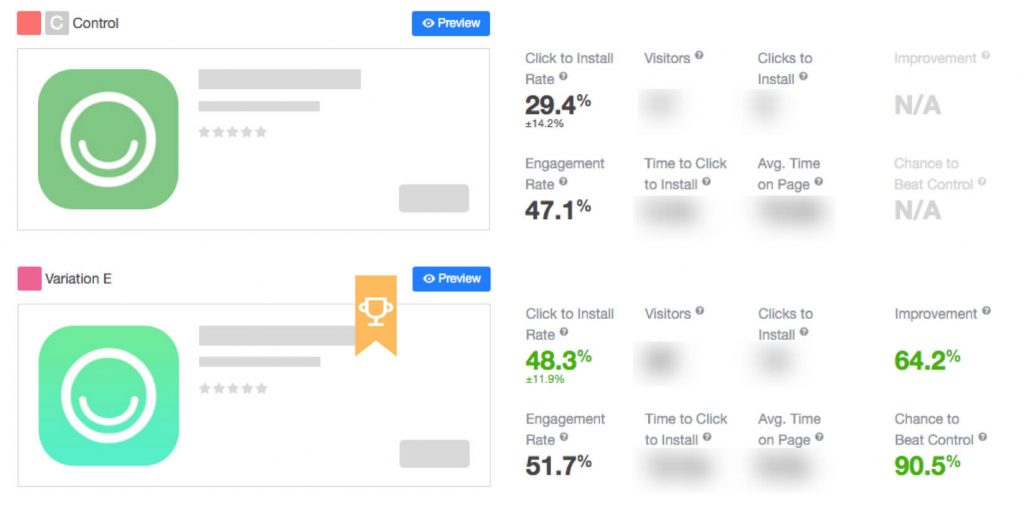
Naturally, we pushed the winning icon live with the next release. After our new icon debuted in the app store, we immediately saw our product page conversion rate jump back to where it was before the rebrand.
Inspired by this app optimizing success in the App Store, we adopted this new icon and color and re-rebranded ourselves across the web retroactively.
This had an unexpected benefit: conversion rates for other inbound tools that used our app’s icon increased, and engagement on social media went up as well.
This single app optimizing activity had a large impact on the overall health of our business. In fact, this test alone had the greatest effect on the trajectory of our business because it improved the efficiency of so many of our tools. It’s amazing what just an app optimizing can do!
After testing the iOS icon, we experimented with our screenshots. Because of our aggressive release cycle and focus on growth, I used to generalize the results of tests on one platform to the other. However, we had to run separate tests on both iOS and Android this time.
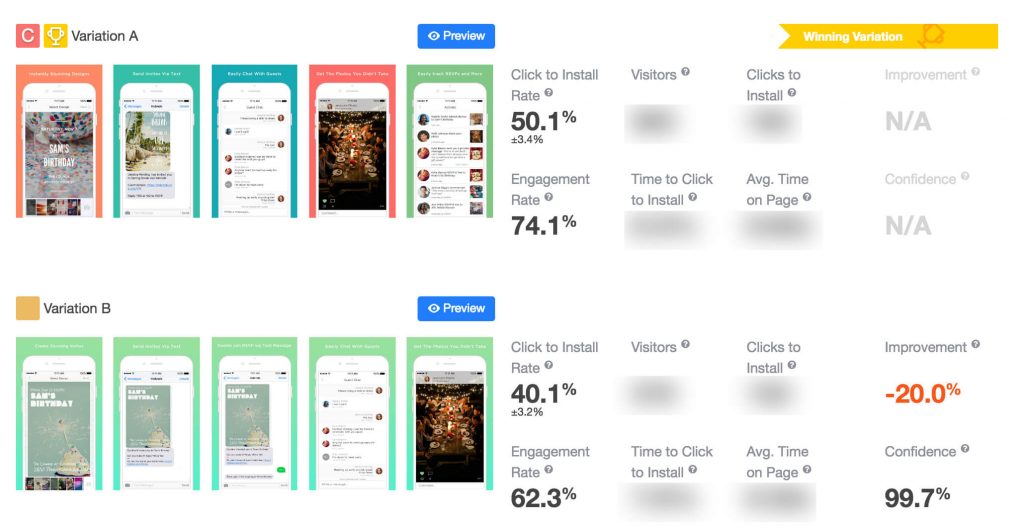
Our screenshots tests are a good example of why it’s better to test before implementing any app optimizing changes. We tested a set of 5 screenshots with the same background against a set of screenshots with different backgrounds.
On Android, the set with the same background led to an increase in conversion, so we rolled this style out to iOS as well. Instead of the expected boost, we saw a decrease in conversion rate, which prompted me to take time to test these screenshots on iOS.
We found that these screenshots actually reduced our conversion rate by 20%. At learning this, we restored the screenshots to the way they used to be. Even though this wasn’t in line with our new branding, we couldn’t ignore the numbers!
Once we implemented the final results from our icon test and screenshot tests, our app conversion rate jumped straight back to where it was before rebranding and increased from there.
The truth about app optimizing – not every test has a winner. In fact, most of my experience with SplitMetrics was running tests that didn’t result in a statistically significant change but provided valuable insight nonetheless.
One of such tests was on our iOS title. iOS titles have competing purposes, they serve as
The perfect app title is one that serves both of these objectives, and that’s what I was striving for.
Through multiple app optimizing tests of titles, I found that the length and wording of the title had no significant effect on the conversion rate. This indicated to me that we could use this field mainly as a tool for ASO, rather than one that needed to elegantly convey the name and purpose of the app.
This gave us the green light to put our most important keywords in the title, which had a significant effect on our App Store search visibility.
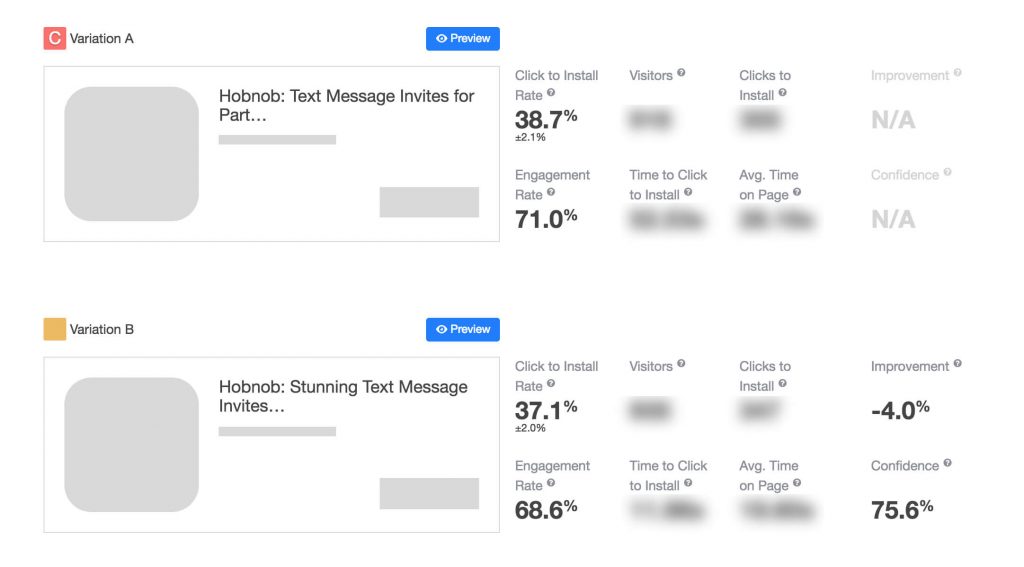
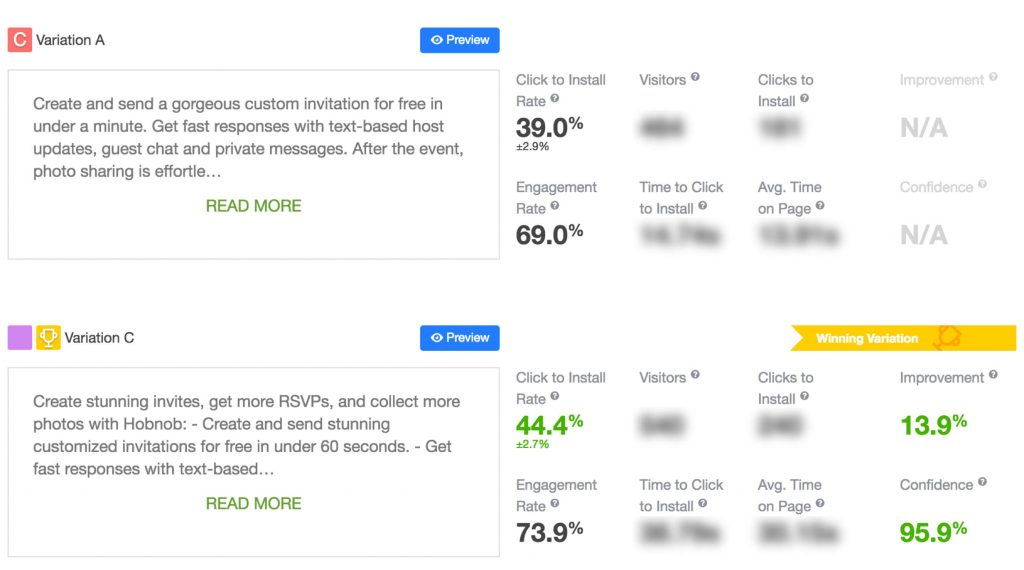
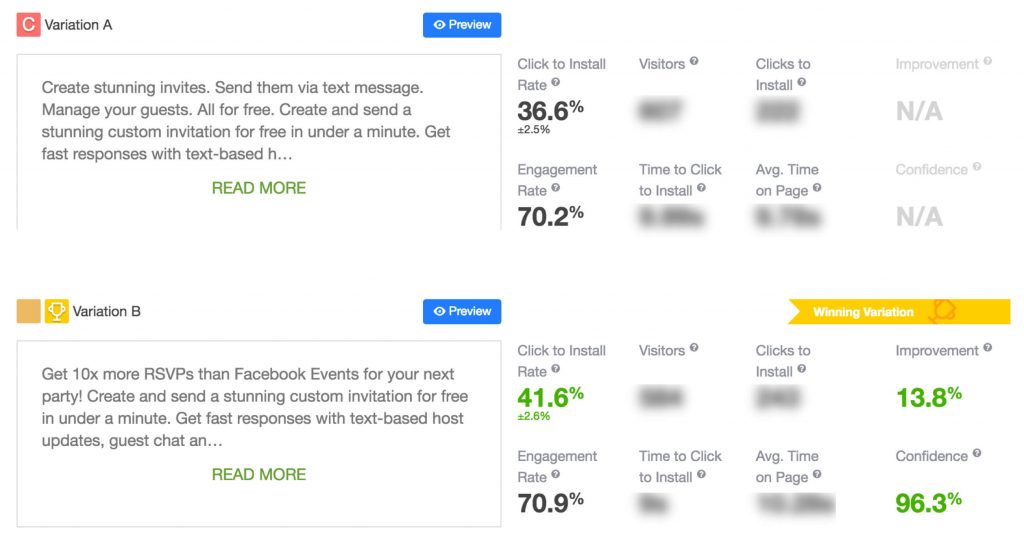
We decided to run a description test twice, and each time we achieved a very good improvement in conversion rates of approximately 13%.
Hobnob is a need-based app, most people who download and use it find the app by searching for “invitations” or “invitation app” on the app store.So Hobnob’s app store listing is often the first touchpoint that users have with the brand.
Hobnob faces a unique challenge in the app store. We compete in a space dominated by two well-known players, and we offer a service that most people don’t even know exists. Within our text metadata, we have to
This app optimizing approach differs from one of the apps that provide a service people are already familiar with, there’s far less education involved in “selling” an app like that.
In the course of our first title test, we learned that we can put “text message” within our title. This keyword piques users interest when it appears within the search results. It also contextualizes the rest of the app store description on the product page.
After clarifying it, we’re free to use our above-the-fold description to speak directly to the top three pain points that Hobnob solves for event hosts. App optimizing of description, we knew that our aim is to educate users on the benefits of a service like ours and making the “sale”.
Overall, my app optimizing advice is to fanatically study and internalize your users’ journey to finding your app – their motivations, their options, their pain, and what they’re looking for.
SplitMetrics gave us the opportunity of:
SplitMetrics’ email collection feature was integral to our Android launch success. Not only did we use SplitMetrics for app optimizing of each element of our Android listing before launch, we were able to collect email addresses of the users who clicked the “Install” button after seeing the app listing.
This allowed us to build up a mailing list of our most qualified Android users before we even launched. By collecting super qualified Android users and keeping them warm through a keep-warm email campaign, we were able to launch our Android app with a 60% conversion rate from product page viewed to download.
This app optimizing result is far above what we’d expected given the need-based nature of Hobnob. This initial boost of traffic, downloads, and accompanying reviews and ratings allowed us to have an extremely strong first week in the Play Store.
As a result of pre-launch app optimizing, we were a couple of months ahead of our growth projections because of the head start this email list afforded us.
Over the course of 5 months app optimizing, Hobnob used SplitMetrics to restore and improve their app store conversion rate. A/B testing helped them to come up with the icon which beat rebranded by 64% in terms of conversion. The Hobnob team also optimized description for almost 14% better tap to install rate.
This ensured an optimized Android listing on launch day and an email list of extremely qualified users, which translated into 60% conversion rate to download during the first month in Google Play.


