It’s a minimum improvement over the conversion rate of the existing asset (baseline conversion rate) that you want the experiment to detect.
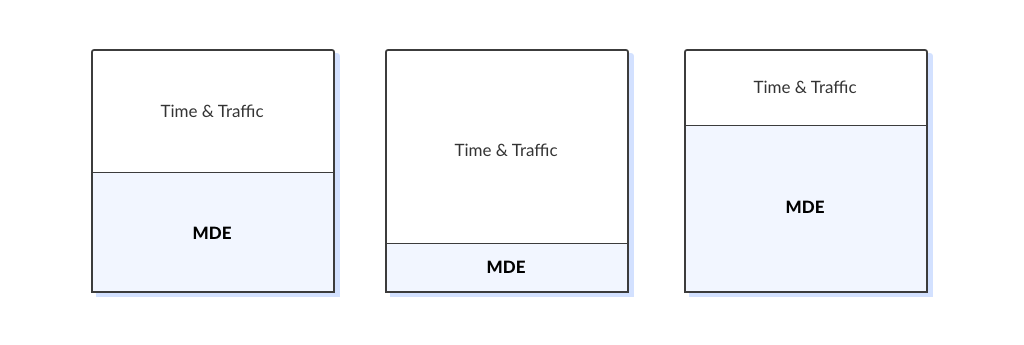
By setting MDE, you define the conversion rate increase sufficient for the system to declare the new asset a winner. The lower MDE you set, the slighter conversion changes will be detected by the system. Basically, MDE measures the experiment sensitivity.
Highly sensitive settings, or low MDE, come along with a big sample size. The lower the MDE is, the more traffic you need to detect minor changes, hence the more money you have to spend on driving that traffic.
So, by configuring MDE you are flexible about connecting the experiment design with the costs you are ready to incur.

Minimum detectable effect is a crucial parameter for evaluating the cost and potential return on running A/B experiments. From the practical perspective of mobile app marketers, choosing the appropriate value of MDE means striking the balance between the cost of acquiring paid traffic for an experiment and achieving meaningful return on investment.
To put it in the most practical terms for SplitMetrics Optimize users: by setting a lower target MDE, you’re instructing the system to collect more views of your app’s product pages before marking the test as statistically significant and completing it.
There’s no such thing as an ideal MDE, so SplitMetrics Optimize can’t recommend you the optimal value. This is a key custom parameter affecting your sample size and, by implication, the costs associated with the traffic. In other words, we suggest you define MDE by yourself, taking into consideration your individual risks – money and time.
This may sound like an overwhelming task, but don’t worry – if this guide and other, freely available materials on our blog are just too much for you, we recommend turning to the SplitMetrics Agency. Using their experience they will recommend the optimal MDE for your experiments – among many other things to make your mobile app grow.
MDE has a dramatic effect on the amount of traffic required to reach statistical significance. To know your maximum sample size, use the Evan Miller calculator for sequential A/B sampling. Make sure that you insert relative value for MDE rather than absolute.
By setting smaller MDE, you tell the system to detect slighter conversion rate changes, which requires more traffic and possibly time. On the other hand, the larger MDE you set, the less traffic (and possibly time) is required to finish the test.
For example, to reach the significance level of 5%, you’ll require 2,922 total conversions with MDE = 10%. with MDE = 5% the sample size grows up to 11,141 total conversions.
Remember, that the sample size you see is only the maximum threshold required for a statistically significant result. Due to the nature of sequential A/B testing, the system will constantly check the difference between conversion rates of variations under testing. Once the difference is found, the test is finished and there’s no need to score the entire sample size.
Although our system can count MDE for you, we strongly recommend setting it by yourself. This parameter depends on your own risks – money you’re ready to allocate for the traffic acquisition and time you can wait for the experiment to run.
To get MDE that works for you, you have to understand:
The best possible MDE implies that the potential revenue exceeds or compensates for the traffic acquisition costs.
Minimum detectable effect is calculated as a percent of the baseline conversion rate:
MDE = (desired conversion rate lift / baseline conversion rate) x 100%
Its practical application is discussed in the workflow below.
Let’s say the conversion rate of your product page with the existing icon is 20% (baseline conversion rate). You assume that the new icon should have at least a 22% conversion rate for you to use it instead of the existing icon.
So, you have to configure an experiment in such a way that it declares the winner when the conversion rate difference is at least 22% – 20% = 2%. To set that up, you have to count your estimated MDE.
MDE is calculated as a percent of the baseline conversion rate:
MDE = desired conversion rate lift / baseline conversion rate x 100%
In this example, 2% of the 20% baseline conversion rate is 10% – this is your estimated MDE for the experiment.
Next step is to get your sample size, using the Evan Miller’s calculator for sequential A/B testing.
You will see the following:
Control wins if: 2,922 total conversions – this is the maximum sample size per two variations (A+B) needed to finish the experiment.
Treatment wins: 106 conversions ahead – means that the system will sequentially check the difference in conversions between variation A (control) and B, and may finish the experiment once the difference of 106 is found, even before reaching the maximum sample size.
Why? Each pair of variations has its individual significance level. As the number of variations under testing grows, so does the overall significance level because those individual values accumulate. The Sidak correction balances out individual significance levels so that the overall significance level equals 5%.
To apply the Sidak correction, use the following significant level values:
| Number of variations under testing (incl. control) | Significance level to set |
| 3 (A+B+C) | 3% |
| 4 (A+B+C+D) | 2% |
| 5 (A+B+C+D+E) | 1% |
The total conversions will appear after you insert all the above in the calculator.
For example, you want to run an experiment with 3 variations – A+B+C. Things you’ll insert in the calculator will be:
Total conversions required: 3,472
In the above example with 3 variations, you’ll get:
total conversions / 2 = 3,472 / 2 = 1,736
Back to the example, as you run an A+B+C experiment, 3 will be your multiplier:
total conversions / 2 * 3 = 5,208
5,208 is the rough estimation of the maximum sample size for an experiment with 3 variations (A+B+C).
In step 2, we’ve calculated the maximum required conversions for an experiment with two variations (A+B) – 2,922. Now that you know the maximum required sample size, you can calculate the possible traffic acquisition costs. Use this formula:
traffic acquisition costs = total conversions / baseline conversion rate * Сost per Сlick
Note: By dividing the total conversions by your baseline conversion rate you gauge your sample size in visitors (those who click on your ad banner).
Let’s say your Сost per Сlick is $0.5 and the baseline conversion rate is 20% (convert it to the decimal form to use in the formula). Your traffic acquisition costs will be:
2,922 / 0.2 * $0.5 = $7,305
When you have SplitMetrics Optimize integrated with Facebook Pixel, you may configure “Complete Registration” as a conversion event. In such a case, the traffic acquisition costs will be calculated considering users who click on the “Get” button rather than those who click on an ad banner.
The formula for cost calculations in such cases will include Cost per Install (not Сost per Сlick):
traffic acquisition costs = total conversions x CPI
Note: As you can see, you don’t have to recalculate sample size in visitors. Just multiply CPI by the total conversions obtained in the Evan Miller calculator.
Let’s say your Cost per Install is $2.5 and the maximum sample size is 2,922 total conversions. Your traffic acquisition costs will be:
2,922 X $2.5 = $7,305
At this point, you have to make sure that these costs line up with the budget allocated for the traffic acquisition:
You may use different ways to calculate the potential revenue from the conversion rate lift, for example, based on the LTV of ASO-acquired app subscribers. In the above described example with two variations (A+B), you have to calculate how much money you will generate from a 2% conversion rate lift.
Once you have your Potential revenue ($Y) calculated, compare it with the Traffic acquisition costs ($X):
MDE is configured after the experiment is created but before you start driving traffic. If you change your MDE after the traffic starts driving to the experiment, you will lose all the statistics.
Don’t modify MDE after you start driving traffic to your experiment. Otherwise, all the statistics – visitors, conversions, improvement, etc. – will be reset.
Evaluating the Minimum Detectable Effect (MDE) in mobile app marketing involves careful consideration of statistical and practical factors. Here are a couple of best practices to keep in mind:
Before determining the minimum detectable effect and configuring your experiments, have a clear understanding of your business goals and the key performance indicators (KPIs) that matter most to your mobile app’s success. Without them, you won’t be able to successfully establish the intersection between statistical significance and business relevance. Similarly, benchmarking helps you evaluate where you actually stand in terms of performance and whether further optimization is viable.
Strive for a balance between statistical significance and practical impact. A statistically significant result might not be practically meaningful if the observed effect is too small to matter to your business goals. On the other hand, setting the bar too high may make the experiment financially unviable. Aim to set an MDE that ensures changes are noticeable and provide a tangible benefit to users, but never lose focus on your ROI.
Mobile app user behavior can vary significantly from other online platforms. Users on Google Play can display behavioral patterns much different to those on the App Store. Experiments for the same creatives can return different results. Consider the unique characteristics of mobile usage, such as attention spans and on-the-go interactions. Recognize that the MDE might be different for various user segments and app stores. This is well evidenced in our reports: the ASO Benchmarks & Mobile Trends Report and How Users Behave on the App Stores: the App Store vs. Google Play.
Leverage sample size calculators or statistical software to estimate the sample size needed to detect your desired minimum detectable effect with a specified level of confidence and power. These calculators take into account factors like baseline metric values, variability, desired significance level (alpha), and desired power. You may also rely on SplitMetrics Optimize to automate the process of setting the right value for MDE and calculating sample size. We highly recommend you read our guide on Calculating Sample Size for A/B Testing: Formulas, Examples & Errors.
To arrive at your best possible MDE, our algorithm will rely on your baseline conversion. Your ideal MDE will be the value which produces a sufficiently large sample size, yet comparable to that in classic A/B testing.
If SplitMetrics Optimize calculates MDE for you, be aware that the result won’t appear straight away. The algorithm will gauge and display your MDE in the interface after your variations gain enough conversions.